03rd Dec 2025
Summary
Pullback trading is a way to enter trends at better prices instead of chasing candles at the top of a move.
In this guide, we explain what a pullback in trading is, how to tell it apart from a full reversal, and how beginners can build a simple pullback trading strategy with clear rules for entries, exits, and risk management.
- Learn what a pullback in trading is and why it matters for trend followers.
- See how to tell a temporary retracement from a true change in trend.
- Follow step by step pullback trading strategy examples for forex, stocks, indices, and commodities.
- Use a practical checklist and risk rules, including how the 7 percent loss rule fits into pullback trading.
What Is a Pullback in Trading?
Before we talk about pullback trading strategies, we need to be clear on the basic definition.
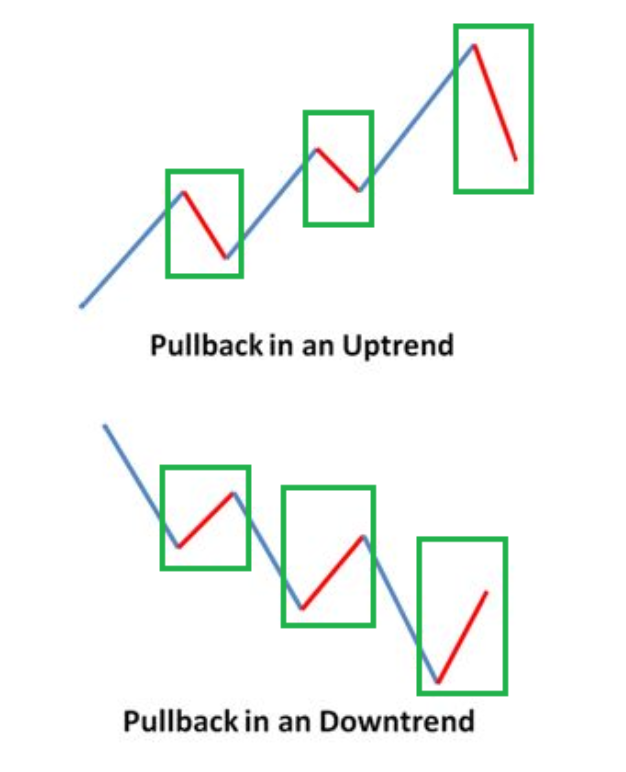
If you are wondering what is a pullback in trading, think of it as a temporary move against the main trend, not a complete trend change.
In an uptrend, price makes higher highs and higher lows. A pullback in trading is the short move down from a recent high into an area of support, before the trend continues higher.
In a downtrend, it is the short move up from a low into resistance, before sellers step back in.
Key Points To Understand
- A pullback is a short term pause or dip within a larger trend.
- Pullbacks do not break the overall trend structure. In an uptrend the last major higher low still holds.
- Traders use pullback trading to enter in the direction of the main trend at a better price.
- A pullback is different from a reversal, which is a deeper move that changes the trend itself.
Clear Definition of a Pullback
In simple terms, a pullback in trading is a counter move that:
- Stays within recent support or resistance levels.
- Often retraces a portion of the last swing, for example 30 to 60 percent of the move.
- Typically lasts a few candles or sessions, not weeks or months.
What a Pullback Signals in the Market
Every pullback tells a story about market psychology. After a strong push in one direction, some traders take profits and others hesitate to buy higher.
The result is a temporary pause that shows up as a retracement on the chart.
Trend Psychology Behind Temporary Dips
During a healthy pullback:
- Buyers do not disappear, they simply wait for better prices.
- Short term traders lock in profits after a strong move.
- Volume often slows compared to the impulsive trend leg.
When the trend resumes, volume and momentum usually pick up again. That shift is what pullback trading strategies try to capture.
How Pullbacks Fit Into Broader Trend Movements
Markets rarely move in straight lines. Even strong trends behave like waves, with an impulsive move in the direction of the trend followed by a corrective move against it.
Pullback trading tries to enter near the end of the corrective wave, just as the next impulsive wave begins.
Pullback vs Reversal: Telling the Difference
One of the hardest parts of pullback trading is knowing when price is only pausing and when the entire trend is about to flip.
For beginners, having a simple framework makes this decision less emotional.
Core Signs That Separate the Two
Broadly, a pullback tends to show:
- Shallower retracements that respect support or resistance.
- Fading volume during the counter move.
- Trend structure still intact, with higher lows in an uptrend or lower highs in a downtrend.
Reversals tend to show:
- Deeper moves that break major swing points.
- Stronger volume in the new direction.
- Momentum indicators turning and staying against the old trend.
How Market Structure Shifts
Many price action case studies show a similar pattern. As long as the last main higher low is not broken in an uptrend, the move is usually classified as a pullback.
Once that low breaks, structure changes and a potential reversal is in play.
Volume and Momentum Clues
Research on stock indices and forex pairs often shows that temporary dips inside an uptrend come with lower volume and slower momentum, while genuine reversals come with a clear surge in both volume and momentum in the new direction.
Quick Checklist for Confirmation
Use this simple checklist when you see a dip and want to know if it is likely a pullback or something more serious.
- Depth: Has price retraced less than about half of the last strong move in the trend direction
- Key levels: Is price still holding a clear support or resistance zone or a major moving average
- Structure: Is the last major higher low or lower high still intact
- Volume: Has volume decreased during the counter move compared to the trend leg
If the first three answers are yes and structure has not broken, we usually treat it as a pullback rather than a reversal.
How a Pullback Trading Strategy Works
A basic pullback trading strategy links three elements. First we define the trend, then we wait for a retracement, then we look for a signal that the trend is ready to continue.
Reading Market Structure Properly
We start on a higher timeframe, for example the 4 hour or daily chart, to avoid noise. An uptrend is a series of higher highs and higher lows.
A downtrend is a series of lower lows and lower highs. In pullback trading, we only look for trades in the direction of that structure.
Spotting the Dominant Trend
Many traders use a long term moving average, for example the 50 or 200 period average, as a quick trend filter.
If price is above the moving average and the line is sloping upward, they treat the market as bullish.
If price is below it and the line slopes downward, they treat it as bearish.
Typical Price Action During a Dip
A pullback often looks slower and more choppy than the impulsive trend move. Candles may overlap, wicks become longer, and ranges shrink.
In some case study examples, volume drops during these corrective phases while trend legs see a noticeable pickup in volume and range.
How To Time Entries During a Correction
The goal of a pullback trading strategy is not to catch the very bottom of a dip. Instead, we wait for signs that the correction is ending.
These can include:
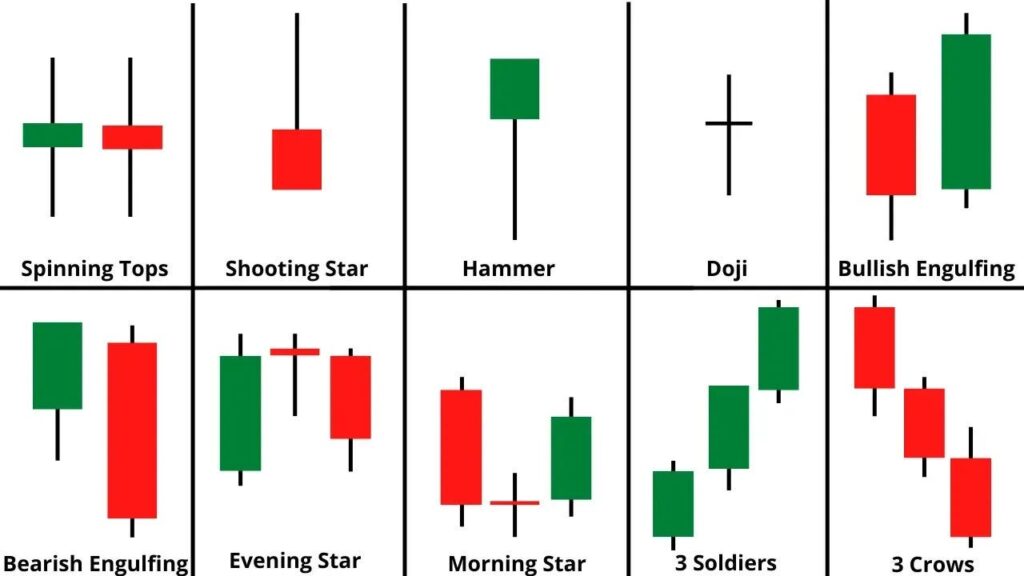
- Bullish candlestick patterns at support in an uptrend, such as a hammer or bullish engulfing bar.
- Bearish patterns at resistance in a downtrend, such as a shooting star or bearish engulfing bar.
- Indicators like RSI turning up from oversold in an uptrend, or down from overbought in a downtrend.
Simple and Complex Pullbacks
Not every pullback looks the same. Some are clean and quick, others are messy and slow. Understanding the difference helps you choose expectations and stop placement.
Traits of a Clean, Simple Pullback
- Single, sharp move back into support or resistance.
- Quick reaction and strong continuation in the trend direction.
- Clear bounce from a moving average, horizontal level, or Fibonacci retracement.
What Makes a Pullback Complex or Choppy
- Multiple overlapping swings, often forming a small range or flag pattern.
- Price tests several nearby levels before choosing a direction.
- Indicators keep crossing back and forth, giving mixed signals.
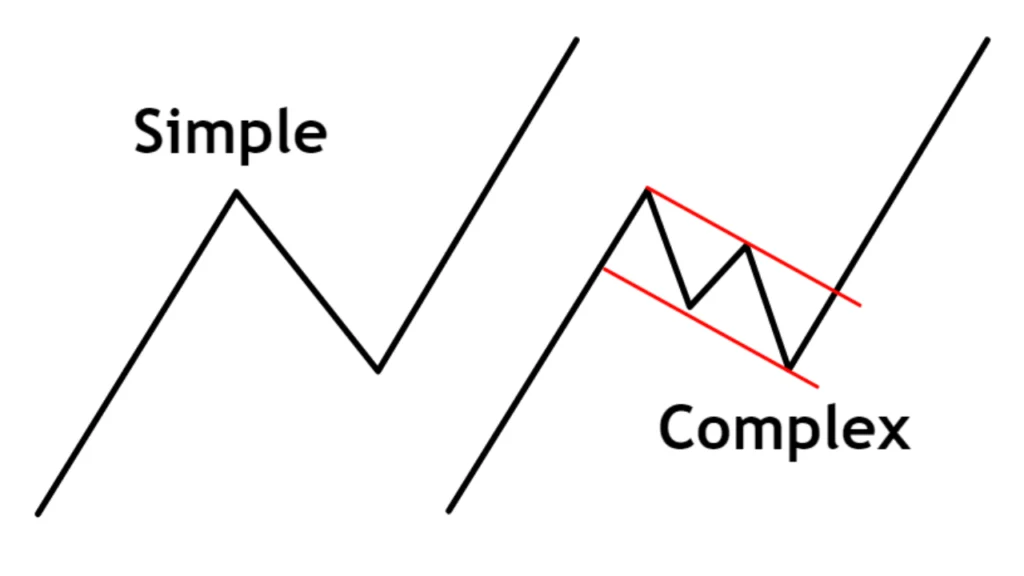
When Each Type Appears and How To Approach Them
Simple pullbacks often appear in strong, steady trends. In these conditions some traders are willing to enter at the first touch of a level with a tight stop just beyond it.
Complex pullbacks are more common in slower markets. In those cases, many traders wait for a clear breakout from the consolidation before entering in the trend direction.
Why Pullbacks Matter for Trend Followers
Trend traders want to buy low and sell high, but still trade in line with the main direction. Pullbacks are the bridge between those two goals.
Entering at Better Prices
Entering after a pullback often means buying closer to support in an uptrend or selling closer to resistance in a downtrend.
That can reduce the distance between your entry and your stop loss compared to chasing a breakout that is already extended.
Improving Risk to Reward
Because your stop can sit just under support or just above resistance, the risk side of the trade can be smaller.
If the trend continues to a new swing high or low, the reward side can be larger. This is why pullback trading is popular with traders who focus on risk to reward ratios.
Riding Trend Continuations With Confidence
When a pullback respects structure and key levels, it gives extra confidence that the trend is still healthy.
That can make it easier to hold winners instead of closing trades too early at the first sign of a small dip.
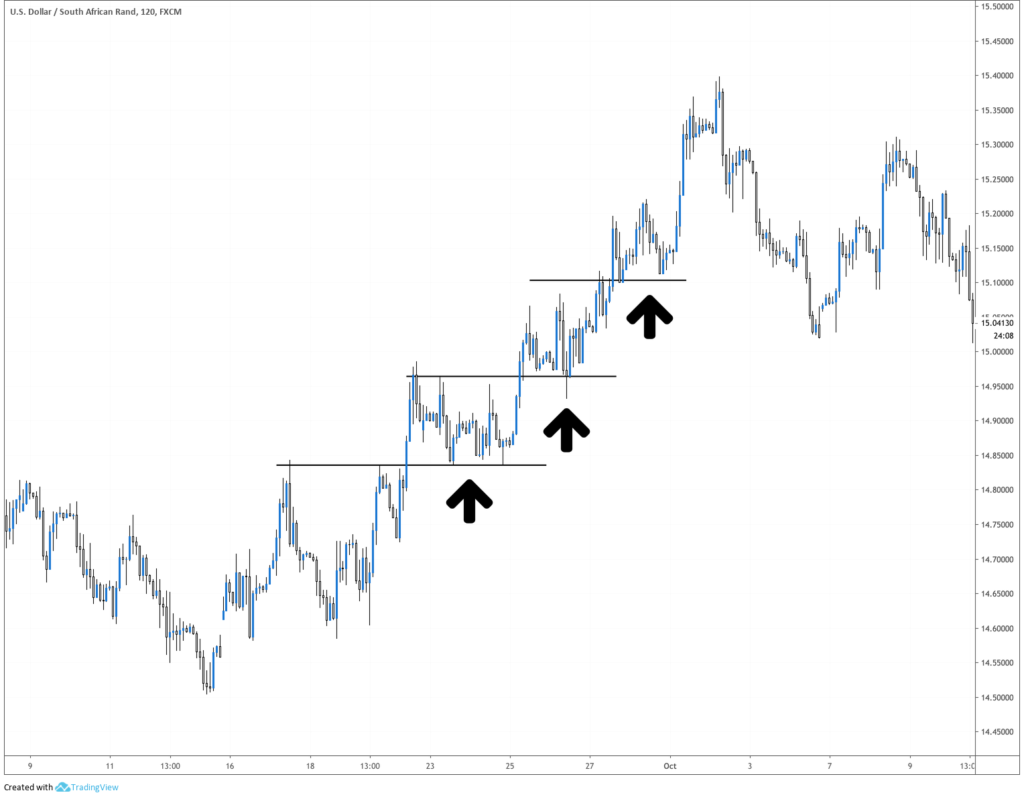
Practical Example of a Pullback Setup
Imagine EUR/USD is in a strong uptrend on the 4 hour chart. Price breaks above a clear resistance level and then pulls back toward that same area, which now acts as support.
- The higher timeframe trend is bullish.
- The pair pulls back to the old breakout level and the 50 period moving average.
- Volume slows during the pullback compared to the breakout candle.
- A bullish engulfing candle forms at support, while RSI turns up from near 30.
A typical pullback trading plan here would be to buy after the bullish candle closes, place a stop just below the support zone, and set a first target near the prior high, with a second target for a measured move beyond it.
Effective Pullback Trading Strategies
Below is a simple comparison of common pullback approaches that beginners can test and refine.
| Strategy | Main Idea | Typical Entry | Stop Placement | Typical Target |
|---|---|---|---|---|
| Support and resistance pullback | Price breaks a key level, then retests it from the other side. | Enter on bullish or bearish signal at the retest level. | Beyond the support or resistance that defines the setup. | Prior swing high or low, or a fixed risk to reward such as 1 to 2. |
| Moving average pullback | Trend uses a moving average as dynamic support or resistance. | Enter when price bounces from the chosen moving average. | Just beyond the moving average or below the last minor swing. | Next significant level in the trend direction. |
| Fibonacci retracement pullback | Price retraces a percentage of the last move, then continues. | Look for confirmation at 38.2, 50 or 61.8 percent retracement. | Below the deepest retracement level that defines the setup. | Back to the prior swing high or low, then potential extensions. |
Entry and Exit Techniques for Pullback Trades
Entry and exit rules keep pullback trading from becoming guesswork. Beginners do best when they write these rules down and follow them consistently.
Using Candlestick Signals
Common confirmation patterns at support or resistance include:
- Hammer and shooting star candles.
- Bullish and bearish engulfing patterns.
- Inside bars that break in the trend direction.
Timing Entries With RSI, MACD, and Stochastic
Oscillators can help with timing, especially for beginners who still struggle with naked charts. For example:
- In an uptrend, wait for RSI to dip toward oversold and then turn up again near support.
- In a downtrend, wait for RSI to rise toward overbought and then turn down again near resistance.
- MACD crossovers back in the trend direction can also act as a secondary confirmation.
Scaling In and Scaling Out Smartly
Many traders do not enter their whole position at once. They might buy half at the first signal and add the other half if price confirms the move.
Scaling out works in the same way in reverse. Close part of the trade at the first target, then let the rest run with a trailing stop.
Tools and Indicators for Pullback Trading
Pullback trading can be done with simple tools. We do not need to overload our charts to build a structured pullback trading strategy.
Key Moving Averages To Watch
Shorter averages like the 20 period EMA often capture shallow pullbacks during strong trends.
Medium averages like the 50 period can catch deeper retracements. Longer averages like the 100 or 200 period are more suited to position traders.
Understanding Fibonacci Levels
Many pullback in trading case studies reference Fibonacci retracements. The most watched levels are 38.2, 50 and 61.8 percent of the last swing.
These levels mean little on their own, but when they line up with support, resistance, or moving averages, they often become stronger zones of interest.
Trendlines, Channels, and Volume Profile
Trendlines and price channels show where pullbacks might stall. Volume profile tools, where available, highlight prices that saw heavy past trading and can act as support or resistance during a pullback.
VWAP and Anchored VWAP Techniques
On some platforms, including multi asset brokers such as AvaTrade and others, traders can use VWAP or anchored VWAP to judge fair value over a session or from a specific event.
Pullbacks into VWAP or an important anchored VWAP line are often watched by short term traders for potential continuation setups.
Managing Risk Within a Pullback Trading Strategy
No discussion of pullback trading would be complete without risk management. Even the best setup can fail, and beginners need a clear plan for losses.
Placing Logical Stop Loss Levels
In an uptrend, stops often go:
- Below the support zone used for entry.
- Below the last significant higher low in the trend.
In a downtrend, they sit above resistance or above the last significant lower high. The key is simple. A stop loss should sit at a price that proves the trade idea wrong if it is hit.
Position Sizing and the 7 Percent Loss Rule
The 7 percent loss rule is often quoted in stock trading. In simple form it says that if a stock drops about 7 percent below your entry, you cut the loss and move on.
The exact percentage is less important than the habit. For pullback trading, we aim to define a maximum account percentage risk per trade, then choose a position size that fits inside that limit.
Setting Clear Risk Reward Targets
Many traders look for a minimum of 1 to 2 risk to reward. If they risk 1 percent of the account on a pullback setup, they aim to make at least 2 percent if the trade works.
Higher reward targets are possible when pullbacks happen early in a trend and there is plenty of room to new highs or lows.
Drawbacks and Limitations of Pullback Trading
Pullback trading is popular, but not magic. It has weaknesses that beginners should respect.
- Sometimes price never pulls back cleanly and trends away without us.
- Sometimes a pullback looks shallow but keeps going and becomes a full reversal.
- News events can blow through levels and stop out even well planned trades.
Common Mistakes Traders Make With Pullbacks
Based on many case studies and our own observations, beginners tend to repeat a few patterns.
- Jumping in too early before any confirmation at support or resistance.
- Treating every small red or green candle as a pullback signal.
- Ignoring the higher timeframe and trading counter to the true dominant trend.
- Using the same stop size in calm and volatile markets instead of adjusting.
How Investors Can Use Pullbacks to Their Advantage
Pullbacks are not only for day traders. Longer term investors can also benefit from buying quality assets when price temporarily dips within a long term uptrend, as long as the underlying fundamentals remain strong.
Investors might:
- Use limit orders to buy at preferred support levels.
- Scale in during multi day or multi week pullbacks in strong trends.
- Avoid adding during deep, high volume drops that suggest a possible reversal rather than a healthy retracement.
Applying Pullback Trading in Real Life
In real markets, pullback trading is about probabilities rather than certainty. You can’t label every move correctly, and not every trade will work.
What matters more is that the winners are larger than our losers and that the process remains consistent.
For beginners, a usual approach is:
- Choose one market and timeframe to focus on at first.
- Define a single pullback trading strategy with clear rules.
- Backtest or forward test it on a demo account.
- Track results, then refine entries, exits, and risk rules over time.

Pullback Trading Checklist
Use this quick checklist before taking any pullback trade.
- Trend confirmed on higher timeframe in one direction.
- Price has pulled back toward a clear level or moving average.
- Depth of pullback is reasonable, not a full collapse of the swing.
- Structure is still intact, last main swing high or low is not broken.
- Confirmation signal appears at the level, such as a candlestick pattern or indicator turn.
- Stop loss is placed at a logical invalidation point.
- Risk per trade fits your plan and account size.
- Target gives at least 1 to 2 risk to reward.
Conclusion: When Pullback Trading Performs Best
Pullback trading works best in markets that are trending cleanly with visible support and resistance levels, reasonable volatility, and no constant surprise news.
In these conditions, trading in the direction of the main move after a temporary dip can offer better entries and clearer risk control than chasing breakouts.
For beginners, the key is to keep the pullback trading strategy simple, respect risk rules such as the 7 percent loss rule concept, and treat every trade as part of a long series rather than a one off bet.
FAQs
What is a pullback in trading?
A pullback in trading is a temporary move against the main trend. In an uptrend it is a short term dip into support before the price continues higher. In a downtrend it is a short bounce into resistance before sellers return.
It does not change the overall trend structure.
Is pullback trading profitable?
Pullback trading can be profitable when it is applied with a clear plan, strict risk management, and realistic expectations.
Many case studies on trends in stocks, indices, and forex show that entering in the direction of the trend after a retracement can improve average entry price and risk to reward compared to random entries.
Profitability still depends on discipline, costs, and emotional control.
What is an example of a pullback strategy?
One common pullback trading strategy is the support and resistance retest. Price breaks above a resistance level in an uptrend, then pulls back to test that same level as support.
Traders wait for a bullish signal at that level, enter long, place a stop below support, and target a move back to or beyond the prior high.
What is the 7 percent loss rule?
The 7 percent loss rule is a simple risk guideline often mentioned in stock trading. It says that if a stock falls about 7 percent below your purchase price, you close the position and take the small loss instead of hoping it recovers.
The idea is to prevent a small loss from turning into a large one. For pullback trading, the exact percentage can vary, but the principle of cutting losses quickly when the trade idea is invalidated remains important.
Disclaimer: Remember that CFD trading involves high risk. Always do your own research and never invest what you cannot afford to lose.