VWAP Indicator for Beginners: How to Read It and How to Use It
 Sam Reid
Staff Writer
Sam Reid
Staff Writer  08th Dec 2025
Summary
The VWAP indicator helps beginners understand whether a price is trading at a fair level during the day by blending price and volume into a single guiding line. It offers a clearer read on trend strength, potential reversals, and intraday support and resistance zones. This guide explains how the indicator works, how to read it correctly, and how to use it with simple techniques rooted in real case study insights.
Some professional trading desks view VWAP as a fairness compass because it shows where most trading volume actually occurred. That means beginners can use it to avoid bad entries, time pullbacks with more confidence, and understand what large traders might be doing behind the scenes.
What Is the VWAP Indicator
At its core, the vwap indicator shows the average price a market traded at during the day once volume is factored in. High volume trades influence the VWAP line more than low volume ones, which helps beginners see where buyers or sellers are most active. When people search for what is vwap indicator, they are usually looking for a simple definition. The cleanest explanation is this: VWAP is a line that resets each day and tells you if the current price is trading above or below the market’s fair value for that session.
Why VWAP Resets Every Day
VWAP is tied to daily market conditions. Since volume and price shift dramatically during each session, the line starts fresh at the open. This reset is what makes VWAP stronger for intraday decisions than multi day indicators.
How Beginners Interpret VWAP
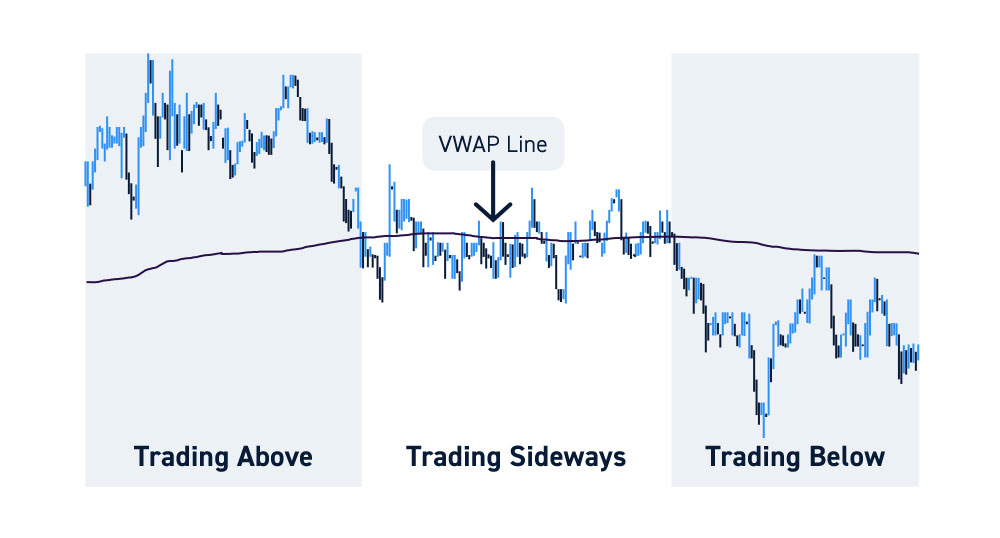
A price above VWAP usually describes bullish pressure. A price below VWAP often reflects bearish pressure. A flat VWAP commonly signals consolidation.
How the VWAP Indicator Is Calculated
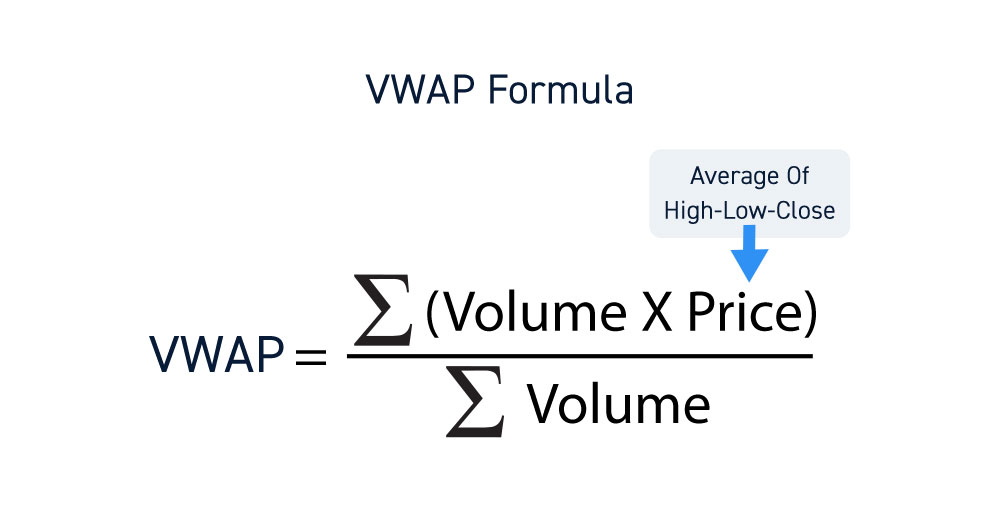
You do not need to calculate VWAP manually, but understanding the foundation helps you read it properly. VWAP uses the typical price for each intraday candle. Typical price equals the high plus the low plus the close divided by three. That price is multiplied by volume to create a cumulative total. This cumulative total is then divided by cumulative volume.
Why This Matters for Beginners
Because the indicator includes volume, it reacts more logically than a simple moving average in periods of heavy activity. When volume spikes, VWAP shifts more quickly. When volume thins out, it stabilises.
How VWAP Appears on Platforms
Most charting tools draw VWAP automatically when selected. On MT4, the vwap indicator mt4 must be added through custom indicators since MT4 does not include VWAP by default. New traders can select it through the Navigator panel once installed. Platforms like MT5, TradingView, and cTrader include VWAP more visibly, which makes them easier to learn on.
How to Read the VWAP Indicator
Reading VWAP correctly allows beginners to avoid emotional entries and instead focus on structured setups.
Price Above VWAP
This often signals buyer strength. If price remains above VWAP for a sustained period, it can indicate a trending environment.
Price Below VWAP
This often signals seller strength. When price stays below VWAP, the market may be leaning toward weakness or downward continuation.
Flat VWAP and Low Momentum
A flat VWAP suggests balanced trading activity without strong directional commitment.
VWAP Bands and Deviations
Some platforms offer VWAP deviations that sit above and below the main line. These deviations sometimes behave as dynamic support and resistance zones and help traders spot extreme prices relative to fair value.
How to Use the VWAP Indicator in Trading
The VWAP indicator helps beginners clarify trend direction, identify fair value zones, and find potential pullback entries.
Identifying Market Trends With VWAP
If price sits above a rising VWAP, the market often reflects a healthier bullish trend. If it sits below a falling VWAP, bearish pressure may continue.
Using VWAP as Support and Resistance
VWAP can behave like a magnet during quiet periods and a barrier during volatile moments. Price often reacts when returning to VWAP, which creates practical entry points.
Entry and Exit Concepts for Beginners
A simple entry technique is to wait for price to cross VWAP, then re test it. This idea keeps beginners from chasing candles far from fair value.
The Beginner Friendly VWAP Trading Strategy
One of the most straightforward VWAP methods for beginners is the pullback strategy. It blends trend confirmation with fair value entries.
Long Trade Rules
- Price moves above VWAP
- Wait for a pullback toward VWAP
- Enter only when the candle respects VWAP and begins to move up again
Short Trade Rules
- Price moves below VWAP
- Wait for a retrace back toward VWAP
- Enter as price turns lower from VWAP
Stop Loss and Target Examples
A stop loss for a long trade can sit slightly below VWAP. A stop loss for a short trade can sit slightly above VWAP. Targets can be previous highs or lows, or the next VWAP deviation.
Real Case Study: VWAP Mean Reversion Precision
A published VWAP order example from Quantified Strategies analysed a 15 minute chart using a mean reversion setup. Traders waited for price to dip below VWAP, then entered long positions and exited once price returned to VWAP. This approach reduced the average closing distance to about zero point two five percent from VWAP. The technique showed how structured entries helped refine timing and improve consistency compared with random or impulsive entries. It also highlighted the strength of using VWAP as a fair value anchor during intraday decision making.
VWAP vs SMA vs EMA for Beginners
Many beginners compare VWAP to moving averages. Each tool has a purpose.
VWAP vs SMA
SMA uses only price data and suits multi day or swing perspectives. VWAP uses volume and works best inside a single session.
VWAP vs EMA
EMA reacts faster to price changes because it weighs recent candles more heavily. VWAP reacts faster only when volume spikes. Beginners often use EMA for fast signals and VWAP for fair value context.
Advantages and Disadvantages of the VWAP Indicator
Advantages
- Adds volume into the calculation
- Helps define intraday fair value
- Provides clean support and resistance zones
- Helps reduce emotional entries
Disadvantages
- Less reliable near market open
- Lags during fast directional moves
- Can offer fewer signals on strong trend days
- Does not forecast future price, only describes current session sentiment
Enhancing VWAP With Additional Indicators
VWAP and MACD
MACD helps confirm trend strength. If price rests above VWAP while MACD trends upward, the alignment often supports bullish continuation.
VWAP and RSI
RSI shows momentum extremes. Overbought RSI near upper VWAP deviation can hint at reversal potential. Oversold RSI near lower deviation can signal bounce potential.
VWAP and Bollinger Bands
When Bollinger Bands widen sharply while price touches a VWAP deviation, this often signals volatility expansion. This can help beginners avoid entering during unstable conditions.
FAQ Section
How do you use the VWAP indicator
You use VWAP by comparing current price to the VWAP line. When price crosses above and successfully retests VWAP, it may offer a long opportunity. When price breaks below and retests, it may offer a short opportunity.
Is VWAP a good indicator
For beginners, VWAP is strong because it reveals trend strength, fair value zones, and realistic entry points. It does not require advanced interpretation.
Is VWAP better than EMA
Neither is universally better. EMA reacts faster and suits scalpers. VWAP offers more context for intraday fairness and suits beginners trying to avoid emotional entries.
Checklist for Beginners Using VWAP
- Check if price is above or below VWAP
- Avoid chasing candles far from VWAP
- Look for pullbacks that re test VWAP
- Confirm trend direction with the slope of the line
- Use a stop loss slightly beyond VWAP
- Avoid trading near market open until VWAP stabilises
- Keep chart clean with minimal indicators
- Review the real case study principles to understand mean reversion behaviour
Final Thoughts
The vwap indicator provides beginners with structure, clarity, and a sense of fairness in an environment where price can often feel random. It encourages patient entries, logical exits, and confident decision making. Traders using VWAP learn to read trend strength with more precision and avoid common mistakes that come from acting too quickly. Tools like the vwap indicator in mt4 make it accessible on most platforms, while subtle insights from real case studies help shape smarter habits as beginners grow into more experienced traders.
Disclaimer: Remember that CFD trading involves high risk. Always do your own research and never invest what you cannot afford to lose.