Trendline Trading Guide: Entry Rules, Risk Management, and Scenarios
 Sam Reid
Staff Writer
Sam Reid
Staff Writer  06th Dec 2025
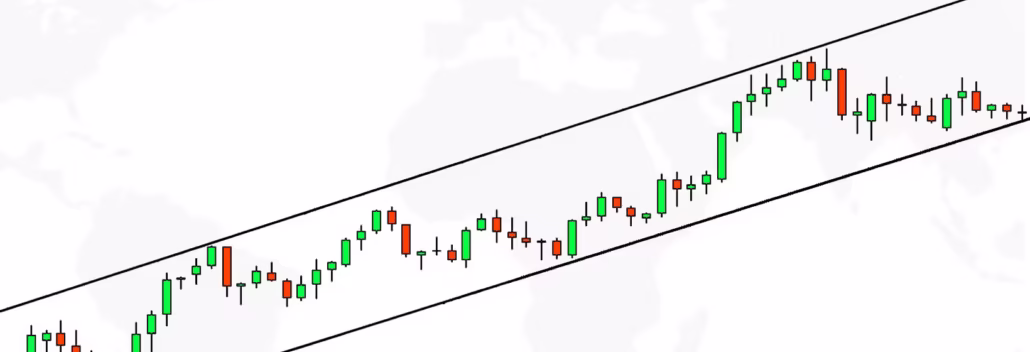
Summary: This guide breaks down how trendline trading works, how to draw accurate lines, the most effective strategies, and how to manage entries and exits with confidence. You will find case studies, examples from forex markets, a checklist for better accuracy, and practical insights from common trader observations.
Traders often say that price remembers. You can see this every time a chart respects the same rising or falling line repeatedly. Trendlines make these reactions easier to understand, and once you know how to use trendline in trading correctly, they become a foundation for identifying direction, timing entries, and managing risk.
What Is a Trendline?
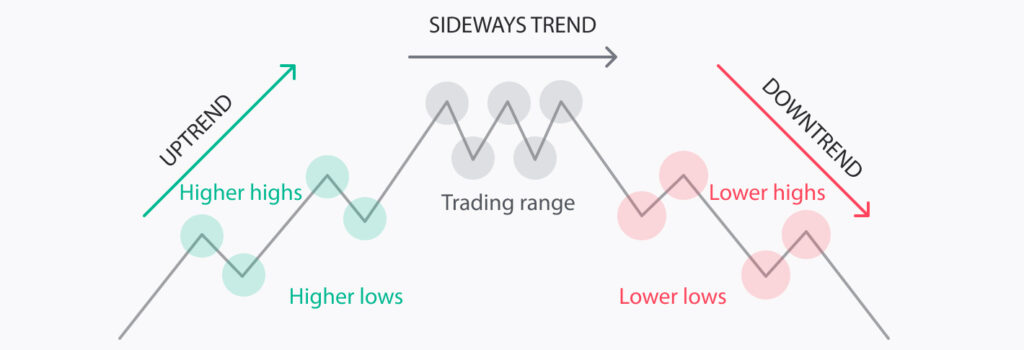
A trendline is a line connecting two or more significant price points on a chart. It shows the prevailing market direction and is a core part of any trendline trading strategy. In forex trendline trading, the goal is to identify whether a currency pair is showing higher lows, lower highs, or moving sideways within a defined structure.
Uptrend vs Downtrend Lines
An uptrend line links rising lows, acting as dynamic support. A downtrend line connects falling highs, acting as dynamic resistance. These lines help visualise momentum and reveal where buyers or sellers consistently step in. Many traders notice that currency pairs often respect a clean trendline more than expected, especially on the four hour and daily charts.
How Trendlines Reflect Market Psychology
Trendlines show where confidence builds or weakens. In an uptrend, buyers repeatedly defend higher lows. In a downtrend, sellers hold control by preventing higher highs. These repeated touches reveal behaviour, pressure, and expectation, which is why a break or bounce often triggers strong reactions.
How to Draw Accurate Trendlines
Drawing clean trendlines requires precision. A line must reflect the true structure of the market, not a trader’s preference. The difference is noticeable, especially on forex pairs like EURUSD or GBPUSD, where thousands of eyes watch the same levels.
Rules for Valid Trendlines
- At least two points are needed to draw a trendline, but a third touch confirms strength.
- The line must connect obvious swing highs or lows.
- It should not cut through candles unless using wick-only method consistently.
- Flatter lines tend to be more reliable than steep ones.
- A trendline must adjust over time as new price information appears.
Common Drawing Mistakes
- Forcing a trendline to fit a bias rather than following real structure.
- Drawing across random minor points instead of meaningful swings.
- Using overly steep angles that break easily during normal retracements.
- Ignoring timeframe context, especially when trading in volatile sessions.
Step-by-Step Guide to Drawing Trendlines
- Locate the main trend on your preferred timeframe.
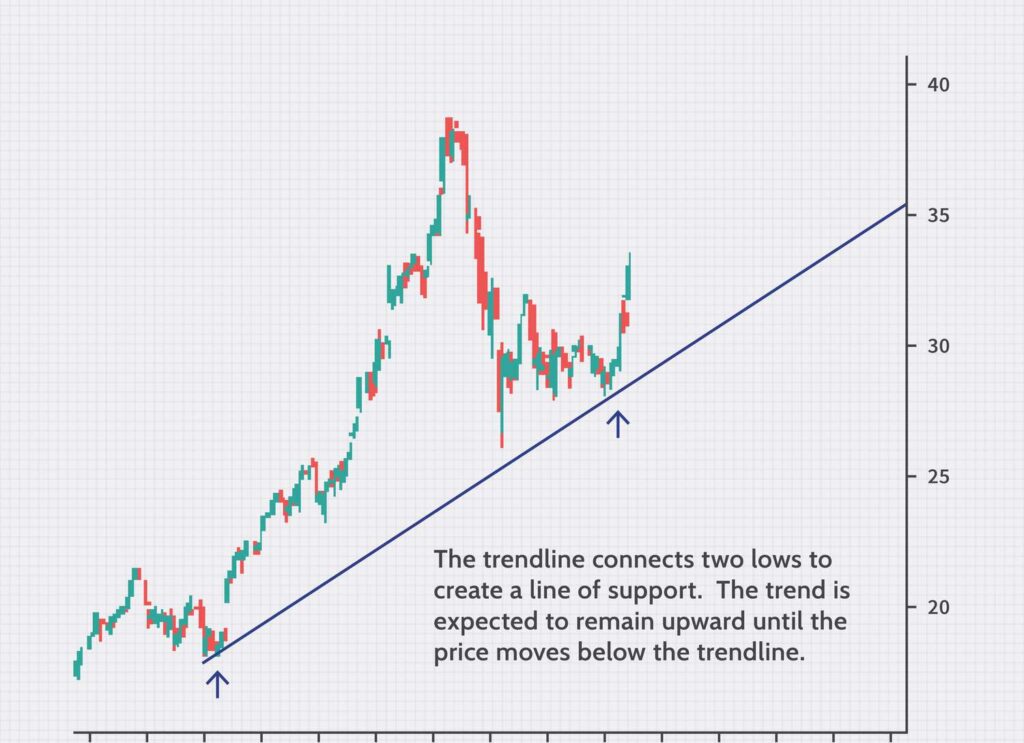
- Identify two clean highs for a downtrend or two lows for an uptrend.
- Connect the points and extend the line forward.
- Wait for a third touch to verify reliability.
- Adapt the line as the market evolves.
Support and Resistance in Trendlines
Trendlines behave like diagonal support and resistance. When the market approaches a well-respected trendline, reactions are common. Some forex traders use this as their primary timing tool and enter only when price interacts with these levels. In the UAE, traders often combine this with sessions overlapping the London open, where reaction strength increases significantly.
Most Effective Trendline Trading Strategies
Trendline Bounce
This strategy looks for price to return to a respected trendline and bounce away from it. Many traders recognise that the early bounce signals often occur with candles showing rejection, such as a hammer or engulfing candle. Stops usually sit just beyond the line for protection.
Trendline Break and Retest
A break of a clean trendline can signal a potential reversal. Rather than entering at the break, traders typically wait for a retest where old support becomes resistance or old resistance becomes support. This creates a cleaner risk reward opportunity.
Trendline Flag Pattern
Flags form when strong trends take a brief pause. Traders draw two parallel lines against the trend, wait for a breakout, and expect continuation. This structure appears often during high momentum forex sessions such as London to New York overlap.
Minor Trendline Break
Sometimes a trendline breaks only slightly before recovering. Traders see this as a false signal designed to trap early entries. A return above the line can offer a safer continuation trade.
Major Trendline Break
A decisive break with strong momentum often marks a trend reversal. This is where traders switch directional bias entirely. Stops are generally placed beyond the most recent swing.
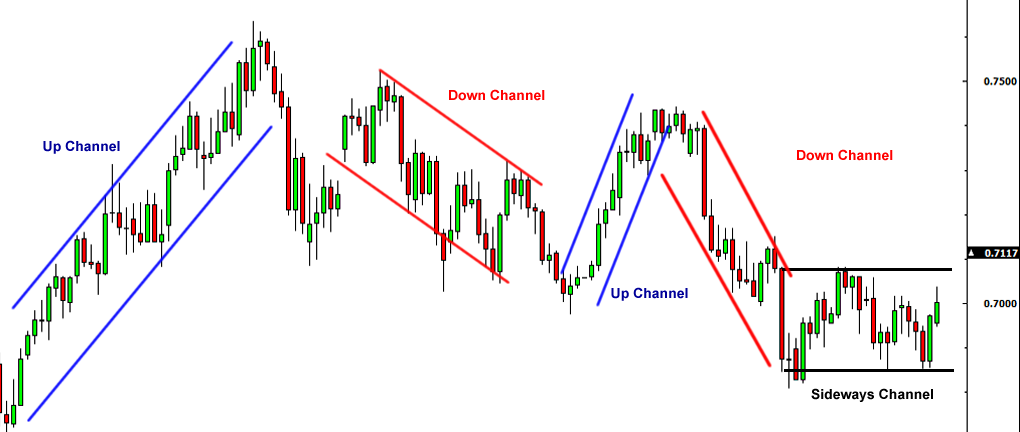
Trendline Channel Trading
Two parallel trendlines create a channel. The lower boundary acts as support and the upper boundary as resistance. Traders buy low and sell high while the channel remains intact. A breakout usually signals a shift in momentum.
Entry and Exit Techniques Using Trendlines
Effective entries rely on confirmation. These confirmations often include candlestick rejection, volume shifts, and indicator agreement. Stops typically sit slightly outside the trendline, while profit targets can use prior structure, Fibonacci levels, or channel height. Trailing stops help protect gains when trends run longer than expected.
Using Trendlines with Other Tools
Confirming with RSI
RSI helps determine if a trendline bounce aligns with an oversold or overbought reading. Divergence also adds strength to a reversal idea.
MACD Confirmation
MACD crossovers and histogram shifts near a trendline touch often signal changing momentum. Traders sometimes wait for alignment before committing.
Fibonacci Retracements with Trendlines
Trendlines frequently align with Fibonacci retracement levels such as 38.2 or 61.8. When both converge, reactions tend to be stronger.
Moving Averages for Confluence
Popular moving averages like the 50 or 200 period often act as dynamic support or resistance. A trendline lining up with a moving average is widely seen as a high probability area.
Advantages and Limitations of Trendline Trading Strategies
Trendlines offer clarity, simplicity, and flexibility across all forex pairs and timeframes. However, traders notice that trendlines can be subjective and break easily during volatile periods. False breaks are common, especially around major economic releases or during thin liquidity sessions.
Tips for Trading Trendlines Successfully
- Use higher timeframe trendlines for confirmation.
- Check volume at key reactions.
- Avoid trading steep trendlines.
- Combine trendlines with support, resistance, and indicators.
- Adapt the line as new data forms.
Common Mistakes to Avoid
- Forcing lines that do not match structure.
- Trading every breakout without confirmation.
- Ignoring market context and session timing.
Trendline Scanners and Tools
Platforms like TradingView, MT4, and MT5 offer reliable trendline tools. Auto detection features help new traders reduce errors. Some UAE traders prefer platforms like Avatrade for charting stability and ease of drawing tools.

Case Study: Clean Trendline Bounce on EURUSD
A trader watched EURUSD form higher lows across several days. After three clean touches on a rising trendline, the pair returned to the level during the London session. A bullish engulfing candle formed, supported by rising volume. The trade targeted the recent swing high and hit the target within hours. Subtle observations show that many reliable bounces occur when both price and session timing align.
Case Study: Failed Trendline Break on GBPUSD
GBPUSD appeared to break a downtrend line during a low volume period. Traders who entered early were caught when the pair returned below the line once liquidity picked up. This is a common scenario where waiting for retest confirmation avoids unnecessary losses.
Checklist for Drawing and Trading Trendlines
- Identify clear swing highs or lows.
- Connect at least two points with clean structure.
- Wait for a third touch to confirm validity.
- Check slope and avoid steep lines.
- Look for confluence with indicators.
- Avoid forcing trendlines onto price.
Table: Trendline Trading Strategy Overview
| Strategy | When It Works Best | Confirmation Tools |
|---|---|---|
| Trendline Bounce | Strong established trends | RSI, candlestick rejection |
| Break and Retest | Reversals and structure shifts | Volume, MACD |
| Flag Pattern | High momentum trends | Breakout volume |
| Channel Trading | Stable ranges | Fibonacci, MA confluence |
FAQs
What is trendline trading?
Trendline trading involves using diagonal support or resistance levels to decide entries, exits, and trend direction.
What is the 5-3-1 rule in trading?
This guideline suggests focusing on five markets, using three strategies, and mastering one time frame. It helps reduce noise and improve consistency.
What is the best trendline to use?
The best trendline is one that connects meaningful swing points, has at least three confirmations, and remains stable across multiple timeframes.
Disclaimer: Remember that CFD trading involves high risk. Always do your own research and never invest what you cannot afford to lose.