How To Use The ADX Indicator
 Sam Reid
Staff Writer
Sam Reid
Staff Writer  24th Aug 2025
• The ADX (Average Directional Index) measures trend strength, not direction.
• Values: 0–20 weak, 25–50 strong, 50–75 very strong, 75–100 extremely strong.
• Combine ADX with Moving Averages, RSI, or MACD for better results.
• Works across stocks, forex, commodities, and crypto.
• ADX can confirm strong breakouts and avoid false signals.
Introduction: Why Traders Rely on ADX
The question many traders ask is: How to use the ADX indicator effectively? The answer lies in understanding that the ADX is one of the most trusted tools for measuring trend strength. Developed by Welles Wilder in 1978, the ADX doesn’t tell you if a market is moving up or down. Instead, it tells you how strong the movement is. And that makes it invaluable for spotting the conditions where profitable trades are most likely to emerge.
Within the first few minutes of looking at an ADX chart, you’ll see its power: it filters out noise, warns of weak trends, and validates strong moves. If you are looking for ways to reduce risk and capture bigger gains, learning how to use the ADX indicator is a step every serious trader should take.
History and Development of ADX
When discussing technical indicators, very few have the staying power of the ADX. The Average Directional Index was developed by engineer-turned-trader J. Welles Wilder Jr. in 1978. Wilder introduced the ADX in his influential book New Concepts in Technical Trading Systems, where he also unveiled other classics like the RSI and Parabolic SAR. His goal was to create tools that captured the realities of price movement across different markets.
Even though markets have changed dramatically since the late 1970s, the ADX remains a core indicator because it measures something timeless: trend strength. Many traders call it the “ultimate trend gauge” because it cuts through short-term price noise and focuses on whether momentum is sustainable. Today, the ADX is built into nearly every trading platform, from MetaTrader to TradingView, and is used by everyone from retail day traders to institutional analysts.
What is the ADX Indicator?
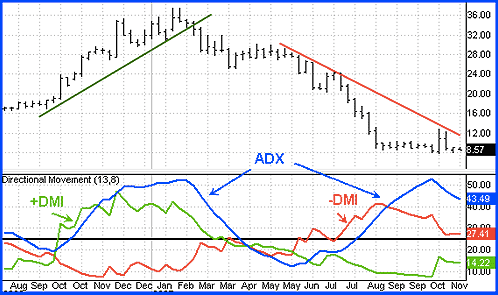
The Average Directional Index (ADX) is a momentum-based trend strength indicator. It is part of Wilder’s Directional Movement System, which also includes the +DI (positive directional indicator) and -DI (negative directional indicator) lines.
- +DI (green line): measures upward movement by tracking higher highs.
- -DI (red line): measures downward movement by tracking lower lows.
- ADX (black or blue line): measures the strength of the trend, calculated from the difference between +DI and -DI.
The ADX ranges between 0 and 100:
| ADX Value | Meaning |
|---|---|
| 0–20 | Weak or sideways trend |
| 20–25 | Possible trend formation |
| 25–50 | Strong trend |
| 50–75 | Very strong trend |
| 75–100 | Extremely strong trend |
How ADX is Calculated (Simplified)
The full formula is complex, but the process can be summarized:
- Directional Movement (DM): +DM = Current High – Previous High; -DM = Previous Low – Current Low.
- True Range (TR): captures volatility and price gaps.
- +DI and -DI: smoothed averages of +DM and -DM divided by TR.
- DX (Directional Movement Index): difference between +DI and -DI as a percentage.
- ADX: moving average of DX values over a chosen period (usually 14).
How to Read an ADX Chart
- ADX Rising: Trend strength is increasing.
- ADX Falling: Trend is weakening or entering consolidation.
- +DI above -DI: Buyers are in control (potential uptrend).
- -DI above +DI: Sellers are in control (potential downtrend).
- Crossovers: +DI crossing above -DI with ADX > 25 often signals bullish conditions.
How to Use ADX Indicator for Trading
Here’s how traders typically use ADX in live markets:
- Confirm trend strength: ADX above 25 validates a tradable trend.
- Filter trades: Avoid setups when ADX is below 20, as markets are rangebound.
- Manage entries and exits: Use ADX peaks and declines to time exits.
- Spot breakouts: Rising ADX above 25 confirms breakout sustainability.
- Avoid false trends: Combine ADX with candlestick patterns or MACD.
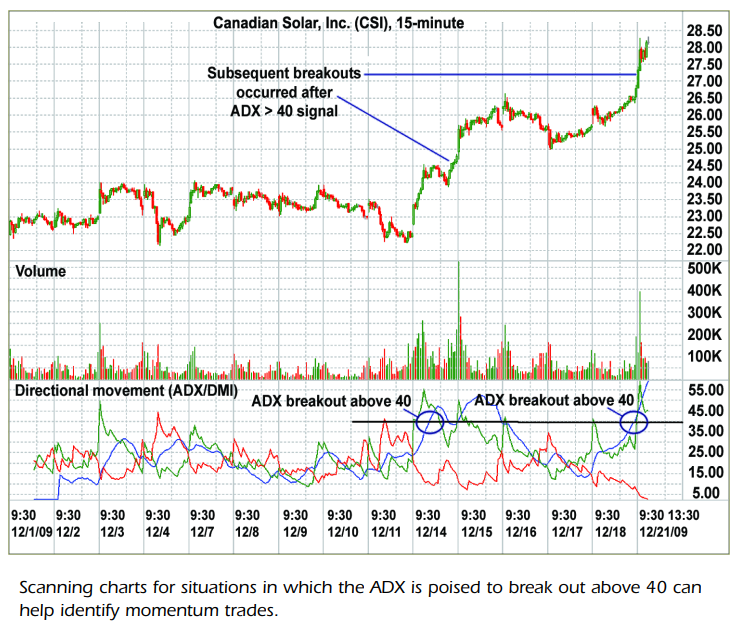
How to Use ADX Indicator for Day Trading
Day traders often adjust ADX for faster signals:
- Use shorter periods like 7 or 10 instead of 14.
- Watch ADX on 15-minute or hourly charts for intraday confirmation.
- Combine with short EMAs for scalping.
- Set tighter stops since volatility is higher.
ADX in Different Markets
One of the strengths of ADX is its versatility across different asset classes. In forex trading, ADX is particularly valuable because currency pairs often trend for long periods. A rising ADX above 25 on EUR/USD or GBP/JPY, for example, can help traders capture extended moves. In the stock market, ADX can confirm whether a breakout from a consolidation is valid, reducing the risk of false breakouts in volatile equities.
For commodities, ADX is often paired with seasonal analysis. Traders use it to confirm whether moves in gold, oil, or copper are supported by strong momentum or just short-lived spikes. In cryptocurrencies, which are prone to sharp swings, ADX helps identify whether a surge is the start of a true trend or a temporary burst of volatility. The adaptability of ADX across markets is one reason it remains popular, no matter what asset a trader focuses on.
Combining ADX with Other Indicators
- Moving Averages: Confirm trend direction.
- RSI: Check momentum and overbought/oversold zones.
- MACD: Spot momentum shifts and divergences.
- Volume: Rising ADX with high volume = strong breakout confirmation.
Practical Example: Gold Trading with ADX
Gold trading between 2530 and 2580 USD/oz shows ADX below 20, confirming a sideways market. A trader waits for +DI to cross above -DI with ADX rising past 25. When price breaks 2577.45, ADX strengthens from 29 to 65. The trader rides the move to 2650, then exits as ADX peaks and falls, locking in gains.
Advantages of ADX
- Objective measure of trend strength.
- Helps confirm valid breakouts.
- Works across multiple asset classes.
- Flexible across timeframes.
Disadvantages of ADX
- Lagging indicator.
- Not predictive of direction.
- Prone to false signals in choppy markets.
- Less reliable in short-term charts.
Common Mistakes When Using ADX
While the ADX is powerful, many traders fall into predictable mistakes when applying it. A common error is relying on ADX alone without considering price action or complementary indicators. Because ADX is non-directional, it should never be used in isolation to decide trade entries. Another mistake is assuming that an ADX reading above 50 always signals opportunity. In reality, markets that strong can often be nearing exhaustion. Traders also sometimes apply ADX to very short timeframes like 1-minute charts, where the indicator tends to generate too much noise. Finally, some fail to adjust the period setting; while 14 is the default, experimenting with shorter or longer settings often provides better signals depending on the market and timeframe.
Tips for Using ADX Effectively
- Always combine ADX with price action or another indicator.
- Adjust period settings based on your trading style.
- Be cautious when ADX is low, focus on range trading.
- Backtest your setups thoroughly.
ADX in Trading Strategies
The ADX can be applied to multiple strategy types. In trend-following strategies, traders use ADX to ensure that a moving average crossover is supported by strong momentum. In breakout strategies, ADX helps confirm whether price leaving a range is backed by sustainable strength. A breakout with ADX rising from 20 to 30 has a higher probability of continuing than one with ADX flat. Finally, in reversal strategies, traders watch for divergence between ADX and price. For example, if price makes a new high but ADX forms a lower peak, it may suggest weakening momentum and the need to tighten stops or scale out. Integrating ADX into strategy design adds both confidence and discipline.

FAQs
How to use ADX indicator for trading?
Traders might use the ADX to confirm trend strength. Traditionally, they might enter trades when the ADX is above 25 with supporting DI crossovers. They may then look to exit when ADX peaks and declines.
What is the best indicator with ADX?
RSI, Moving Averages, and MACD are the most effective complements. They provide direction and timing, while ADX confirms strength.
How to read an ADX chart?
Check if ADX is rising or falling. +DI above -DI could suggest bullish conditions, while -DI above +DI could suggest bearish conditions.
Conclusion
Knowing how to use the ADX indicator is a skill that separates disciplined traders from impulsive ones. By focusing on trend strength rather than chasing every price move, ADX users gain clarity and reduce noise. The indicator’s real value lies in filtering out weak setups, confirming strong ones, and managing risk during momentum shifts.
Whether swing trading gold, day trading forex, or analyzing tech stocks, ADX can be a cornerstone of your trading strategy. Combined with tools like RSI, MACD, and moving averages, it provides a structured approach to navigating volatile markets. The strongest profits often come from the strongest trends and ADX is the compass to find them.
Disclaimer: This content is for educational purposes and should not be conscrued as investment advice. Remember that forex and CFD trading involves high risk. Always do your own research and never invest what you cannot afford to lose.