How To Use RSI For Day Trading
 Sam Reid
Staff Writer
Sam Reid
Staff Writer  17th Aug 2025
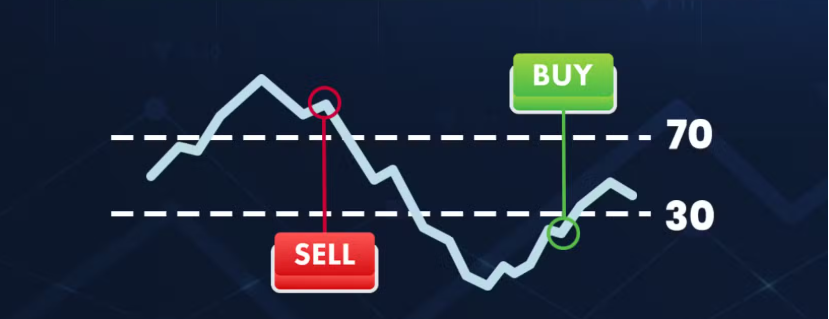
Short-term traders know that timing is everything. The difference between a winning setup and a losing one often comes down to how effectively you read momentum. This is where the Relative Strength Index, or RSI, becomes a trader’s best friend. So, how does the RSI indicator work for day trading? At its core, it measures the speed and magnitude of price changes, helping traders identify when an asset is potentially overbought, oversold, or showing signs of trend continuation. By learning to set the right period length, adjust levels, and combine RSI with other tools, day traders can transform it into a powerful signal generator that guides entries and exits.
Understanding the Basics of RSI
The RSI was developed by J. Welles Wilder Jr. back in 1978, and it has held its ground despite newer indicators being introduced. It is a momentum oscillator that ranges between 0 and 100. Typically, an RSI value above 70 is interpreted as overbought, while a value below 30 is seen as oversold. The midpoint, 50, acts as a pivot. A reading above 50 suggests that average gains are stronger than losses, while below 50 indicates selling pressure dominates.
The formula for RSI might look complex on paper, but every charting platform calculates it automatically. Traders simply need to choose their period setting, with the default being 14. That means RSI looks back over 14 candles to calculate average gains and losses.

Why RSI Matters for Day Traders
Day trading means reacting quickly to price changes on lower timeframes such as 1-minute, 5-minute, or 15-minute charts. Using the default RSI(14) that works well on daily charts often lags behind the action on these faster intervals. For this reason, shorter RSI periods and adjusted overbought/oversold levels are needed.
A key advantage of RSI is that it doesn’t just tell you if something is “overbought” or “oversold.” It also reveals momentum strength, divergence signals, and helps confirm whether a trend is intact. In other words, it’s not only about spotting reversals. RSI can just as effectively be used to trade with the trend.
Best RSI Period for Day Trading
When it comes to short-term trading, the best RSI period for day trading is usually between 7 and 10. Traders who scalp on 1–5 minute charts often prefer settings as low as 5 to 7 for faster responsiveness. This allows them to catch momentum shifts almost as soon as they happen. However, this comes with the tradeoff of more false signals.
For intraday trading on 5- or 15-minute charts, RSI(9–10) tends to be a sweet spot. It captures about 45–50 minutes of market activity on a 5-minute chart, balancing sensitivity with accuracy. Swing traders operating on hourly or daily charts often stick with RSI(14–21) because smoother signals matter more than speed.
A trader working with EUR/USD, for example, might choose RSI(9) on a 5-minute chart when volatility is high around economic news releases, but switch to RSI(14) on the hourly chart when monitoring a longer setup. This flexibility is crucial for adapting to market conditions.
Fine-Tuning Overbought and Oversold Levels
The traditional 70/30 levels are useful, but for day trading they can produce too many whipsaws. Instead, many experienced traders adjust to 75/25 or even 80/20 in volatile markets. This filters out noise and forces traders to only act on stronger signals.
Another effective adjustment is using 60/40 as confirmation levels. Above 60 suggests bulls are firmly in control, while below 40 points to bearish dominance. Using this method, traders don’t need to wait for extreme readings to identify high-probability entries. For example, in an uptrend, pullbacks to RSI around 50–60 can serve as buying opportunities, while in a downtrend, rebounds to 40–50 can signal shorts.

(Traditional Oversold and Overbought RSI zones)
The Role of the 50 Line
The 50 line is often overlooked, but it is one of the most valuable parts of RSI. Think of it as the battleground where bulls and bears fight for control. If RSI holds above 50, it signals that the prevailing momentum is bullish. Conversely, remaining below 50 shows bearish pressure.
This is the basis of the “50-50” RSI strategy. Traders wait for RSI to break and hold above 50 for long entries, or to stay below 50 for shorts. If RSI hovers around 50 without commitment, it’s often best to stay out until direction becomes clearer.
Common RSI Strategies for Day Trading
1. The Classic Overbought/Oversold Approach
Traders look to buy when RSI dips below 30 and then climbs back up, or sell when it rises above 70 and turns lower. While simple, this works best in range-bound markets rather than trending ones.
2. The 60-50-60 Strategy
Instead of extremes, this strategy focuses on trend continuation. In uptrends, RSI typically oscillates between 50 and 80. The idea is to buy on pullbacks toward 60, as long as RSI stays above 50. In downtrends, RSI hovers between 20 and 50, and traders look to short when RSI rebounds to 40–50 but remains below 50 overall.
3. The 5 Minute RSI Strategy
On very short timeframes, using RSI(9) with adjusted 75/25 levels works effectively. Traders can combine this with a moving average like the 9 EMA to confirm signals. For instance, if RSI crosses above 50 while the price is above the EMA, it provides stronger conviction to enter a long trade.
4. Divergence Trading
RSI divergence is one of the most reliable signals for reversals. A bullish divergence occurs when price makes lower lows but RSI makes higher lows. A bearish divergence forms when price sets higher highs but RSI fails to follow. These signals often precede significant turning points, especially when combined with other forms of analysis.
Combining RSI With Other Indicators
RSI is powerful, but it should never be used alone. Traders get better accuracy by pairing it with tools that confirm market direction. Some of the most popular choices include:
-
Moving Averages: The 50 EMA and 200 EMA help filter trades. Only take RSI buy signals if price is above the EMA, and sell signals if price is below.
-
MACD: This is widely considered the best indicator to use with RSI for confirming momentum. A bullish MACD crossover lining up with RSI strength creates a strong entry signal.
-
Volume Tools: RSI signals supported by higher volume (VWAP, OBV) are generally more reliable.
For example, during a trending session on the NASDAQ, a trader might see RSI(9) crossing above 50, supported by a bullish MACD signal, while price remains above the 50 EMA. That combination offers much more confidence than RSI alone.
Practical Examples
-
Forex Example: On a 15-minute EUR/USD chart, RSI(9) dipped to 25 during a London session pullback. Price quickly bounced, and RSI climbed back above 30 while staying above the 200 EMA. This confirmed a continuation of the uptrend, leading to a solid intraday long trade.
-
Stock Example: A trader watching Tesla on a 5-minute chart notices RSI divergence. The stock makes new highs, but RSI peaks lower. Volume drops, and soon after, Tesla retraces sharply. This shows how RSI can warn of fading momentum.
-
Crypto Example: On Bitcoin, RSI(7) surged above 80 on a 1-minute chart during a news-driven spike. Experienced traders didn’t instantly short. Instead, they waited for RSI to dip back under 70 to confirm momentum exhaustion before considering a countertrend position.

Mistakes Traders Make With RSI
-
Blindly selling at 70 or buying at 30 without considering trend direction.
-
Over-optimization by constantly tweaking settings instead of mastering one approach.
-
Ignoring risk management. Even the best RSI setup can fail. Always use stop losses and size trades appropriately.
-
Not adjusting settings to volatility. RSI levels that work in calm markets may not work in high-volatility conditions.
Backtesting RSI Strategies
Before applying any RSI strategy live, traders should backtest it. Look at at least 6 months of historical data and record metrics like win rate, average gain, and maximum drawdown. Paper trading is also a good way to build confidence before risking real money.
This process highlights whether a strategy works across different assets, such as forex pairs, stocks, or crypto, or if it needs fine-tuning for specific markets.
Final Thoughts
The RSI remains one of the most practical tools for day traders. Its ability to highlight momentum, trend shifts, and divergences makes it versatile across all markets. The best period for RSI varies depending on style, but settings between 7 and 10 work best for most intraday traders. Adjusting levels to 75/25 or 60/40 further improves accuracy, while combining RSI with moving averages, MACD, or volume creates a more robust system.
The most important lesson is that no single RSI setting guarantees success. Traders who adapt the indicator to their own style, backtest diligently, and use it alongside sound risk management will have the best chance of consistent results.
FAQs
What is the best RSI period for day trading?
Most day traders find RSI(7–10) effective on intraday charts, especially 5- and 15-minute timeframes. It balances responsiveness with fewer false signals.
What is the 70 30 rule in RSI?
It refers to the default settings where RSI above 70 suggests overbought conditions and RSI below 30 signals oversold conditions. Traders often modify these levels to 75/25 or 60/40 for day trading.
What is the 60 60 50 RSI strategy?
This strategy is a variation of trend-following RSI approaches. In uptrends, RSI stays above 50 and often between 60–80. Pullbacks to around 60 become buying opportunities. In downtrends, RSI remains below 50 and rebounds to 40–50 are shorting zones.
Which time frame is best for daily trading?
Day traders usually focus on 1-minute, 5-minute, and 15-minute charts. The 5-minute timeframe is especially popular because it balances signal frequency and reliability.
Disclaimer: Remember that forex and CFD trading involves high risk. Always do your own research and never invest what you cannot afford to lose.