How to Use Bollinger Bands
 Sam Reid
Staff Writer
Sam Reid
Staff Writer  14th Oct 2025
Summary
- Bollinger Bands centre on a moving average with two bands set by standard deviation that expand and contract with volatility.
- Use them to find squeezes for breakouts, fades for mean reversion, and trend continuation when price rides the upper or lower band.
- Pair with a confirmation tool such as RSI, MACD, volume or a price action pattern like W bottom or M top.
- Translate signals into a trade plan that covers entry, stop, position size and exit. The method is only as good as the risk management behind it.
- For UAE and wider GCC traders, align setups with Gulf market hours, funding routes and an Islamic account option where needed. A simple action map is included below with a subtle example using Exness for implementation.
What Bollinger Bands are and why traders use them
Bollinger Bands were introduced by John Bollinger to visualise volatility and relative price extremes. The tool draws three lines on price
- Middle band the simple moving average of period n, common default is 20
- Upper band the average plus k standard deviations
- Lower band the average minus k standard deviations
With n set to 20 and k set to 2, you get a responsive channel that widens as volatility rises and tightens as volatility cools. Traders watch for three broad behaviours
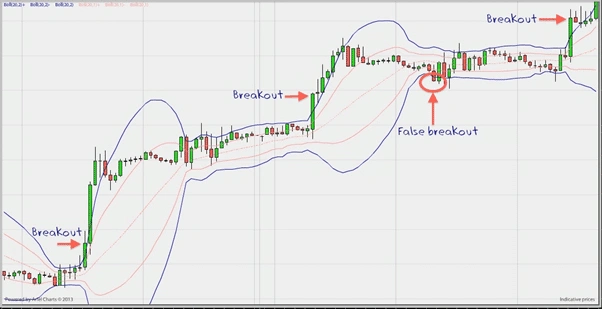
- Squeeze narrow band width that often precedes expansion
- Walk price hugging an outer band during a strong trend
- Reversion price returning toward the middle band after stretching to an extreme
How to calculate Bollinger Bands
Calculation is simple and transparent
- Middle band equals
SMA(n) - Upper band equals
SMA(n) + k × standard deviation(n) - Lower band equals
SMA(n) − k × standard deviation(n)
Standard deviation measures how dispersed the last n prices are around the average. Wider dispersion equals wider bands. You can change n and k to tune sensitivity. Shorter period and smaller k react faster but create more noise. Longer period and larger k react slower but filter more whipsaws.
How to use Bollinger Bands as a complete trading workflow
Step 1 identify the market state
Squeeze and expansion
When bands are the narrowest relative to recent history, the market is coiled. Many traders scan for the smallest BandWidth over the last several months, then wait for a break in either direction. Expansion after a squeeze often fuels a directional move.
Trend and walk
In a strong up move, pullbacks often hold near the middle band while closes appear near or above the upper band. The mirror image holds in down moves. This behaviour suggests continuation until a clear break and close through the middle band.
Step 2 define entries that fit the state
- Squeeze breakout entry plan a stop order just above the recent range high for a potential long or just below the range low for a potential short. Confirmation can be a close outside the band and an uptick in volume.
- Mean reversion entry when price spikes beyond an outer band then snaps back inside on the next bar, some traders fade toward the middle band, especially if an oscillator diverges from price.
- Trend pullback entry during an up move that walks the upper band, buy the first bullish candle that forms near the middle band. Exit plan favours new highs or a trailing method.
Step 3 set protective stops and size the position
- Initial stop for breakouts, many place the stop just beyond the opposite side of the setup, for example under the range low for longs. For reversion trades, a stop can sit outside the extreme that triggered the signal.
- Position size base size on distance to stop and a fixed risk per trade. A common rule is to risk a small fraction of account equity per attempt so that a series of attempts does not damage the account.
- Trailing idea use the middle band or an ATR based trail. If long, exit on a close below the middle band or when ATR trail is hit.
Three practical setups that use Bollinger Bands
W bottom with band confirmation
First low tags or pierces the lower band then price bounces toward the middle band. The second low prints inside the band while an oscillator holds a higher low. A break above the swing high between the two lows completes the pattern. The invalidation is a new low that closes below the first trough.
M top with band confirmation
First high tags or pierces the upper band then price dips toward the middle band. The second high forms within the band. A close below the swing low between the two highs confirms a potential top. Invalidation is a close through the second high.
Three pushes to high or low
Momentum often fades in a series of pushes where the first prints outside the band, the second prints near the band, the third prints inside the band. This sequence hints at exhaustion. The trigger can be a break of a minor trendline or a close through the middle band.
Make it work in the Gulf region
Traders in the UAE and across the GCC face a unique schedule, a mix of local and global assets, and local funding methods. Here is how to apply how to use bollinger bands in a local context
- Time of day volatility often picks up when Europe opens and again when the United States opens. If you trade squeezes, focus scans around those overlaps.
- Local funding and withdrawals choose a broker that supports fast card top ups and local currency friendly rails where available. If you require a swap free account, confirm the terms before you scale risk.
- Asset choice for gold and major currency pairs, spreads during the busiest hours are often tighter. For regional equities, check exchange session times and news calendars.
Action map to go from chart idea to live trade
- Pick your market for beginners, major forex pairs, gold or liquid indices can be more forgiving in terms of spread and liquidity.
- Set the template apply 20 period SMA with two standard deviations. Add RSI or MACD for momentum confirmation and a volume pane if available.
- Scan mark instruments with the narrowest bands relative to their recent range. Build a watchlist of five to ten names.
- Define triggers write the exact price that signals entry and the exact price that signals exit if wrong. You can prepare both long and short conditions.
- Paper test forward test ten trades on a demo for scorekeeping. Record win rate, average reward to risk and whether exits followed the plan.
- Deploy small start with minimal live size until you complete fifty to one hundred trades with stable execution.
Open a risk controlled demo, then graduate to a small live position after a tested plan.
Example platform flow- A popular route among Gulf traders is to open a demo, practice the squeeze and reversion setups, then upgrade to a live account with a broker that supports quick card deposits and an Islamic account option. Exness is a common choice in that scenario because the onboarding is straightforward and the platforms available fit both desktop and mobile. Use this as a practical example, then choose the provider that fits your own due diligence.
Parameters and timeframe selection
| Style | Typical period and deviation | Notes |
|---|---|---|
| Intraday scalping | 20 period on five minute or one minute, deviation 2 | Fast signals, more noise, consider a session filter that avoids dull hours |
| Day trading | 20 period on fifteen minute or thirty minute, deviation 2 | Good balance of signal and noise, pairs well with volume spikes |
| Swing trading | 20 period on four hour or daily, deviation 2 | Cleaner trends, wider stops, smaller position sizes |
| Slow trend following | 50 period or 100 period on daily, deviation 2 or 2.5 | Filters many false breaks, later entries, later exits |
Tip
Two helpful companions are percent b and BandWidth. Percent b shows where price sits between the bands from zero to one. BandWidth visualises the distance between bands. These help you scan and quantify rather than eyeball every chart.
Risk and money management that fits Bollinger Bands
- Fixed fractional risk choose a small percentage of equity at risk per trade. This keeps losses bounded while you collect statistics.
- Stop placement logic for breakouts, a stop beyond the failed edge makes sense. For reversion, a stop beyond the extreme wick can work. Make the distance mechanical so you do not move stops emotionally.
- Take profit logic common exits include a touch of the opposite band or a scale out at one times risk then a trail for the rest. Write the rule in your plan so the decision is already made.
- Session close intraday traders in the Gulf often flatten before the least active hours to avoid spreads that can widen.
Use case examples that link to action
Gold during the Europe to US overlap
Gold often compresses before major data releases. A visible squeeze can form near midday Gulf time. A breakout bar that closes outside the band with a volume pop is a clear trigger. The stop can sit under the inside bar low. Manage the trade into the US session with a trail under higher swing lows.
Major currency pair during Asian drift
When markets drift overnight, the bands can tighten. A push beyond the band without momentum often snaps back toward the middle band. That is a candidate for a mean reversion fade with a small target and quick exit.
Regional equity with a news catalyst
If a UAE listed stock gaps on news and begins walking the upper band, the middle band becomes a dynamic reference. As long as pullbacks hold above it on closing basis, continuation is valid. A close through the middle band warns to lock in profits.
Checklist before you click buy or sell
| Requirement | Why it matters |
|---|---|
| Clear market state squeeze, trend or reversion | Avoid mixed signals and save attempts for clean conditions |
| Confirmed trigger such as close outside band or pattern break | Prevents random entries inside noise |
| Written stop and size | Controls downside and standardises risk |
| Exit rule opposite band, fixed target, or trail | Removes guesswork under pressure |
| Broker routing, platform and funding ready | Execution and payouts are part of edge, not an afterthought |
Subtle recommendation for implementation
If you want a simple place to practice this process, open a demo with a broker that is widely used by Gulf traders and offers straightforward account setup. Exness fits that profile for many traders who want fast platform access and an easy upgrade path from demo to live. Use this only as an implementation example. Always compare several providers, read terms and confirm that features like swap free accounts and quick funding routes match your needs.
Common mistakes to avoid
- Treating a band tag as a signal on its own a touch of the band is information, not an automatic trade. Wait for context and a trigger.
- Using one timeframe only align the signal timeframe with a higher timeframe bias to reduce conflicting trades.
- Ignoring costs spreads and overnight charges can erode edge. Factor these into the plan in advance.
- Moving stops once the stop is placed by rule, keep it until the plan says to trail or exit.
FAQs
How do you use Bollinger Bands effectively
Start by deciding whether you want to trade breakouts or reversions. For breakouts, scan for squeezes and look for a decisive close outside the band with rising volume, then place the stop beyond the opposite edge. For reversion, wait for a spike beyond an outer band followed by a close back inside, then target the middle band. Pair each approach with a momentum or pattern confirmation and a fixed risk plan.
What is the best timeframe for Bollinger Bands
The best timeframe is the one that matches your holding period. Intraday traders often work with five minute to thirty minute charts. Swing traders often prefer four hour and daily. The parameters remain the same in principle. What changes is the time between entry and exit and the size of the stop.
What is the rule for Bollinger Bands
There is no single rule that fits every market. A practical rule set is to define market state first, then trade either expansion from a squeeze or reversion from an extreme, and always use a written stop, a position size that fits your account, and a pre planned exit. A tag of a band alone is not a sufficient rule.
Do professional traders use Bollinger Bands
Yes, many professionals use them as part of a broader toolkit. Bands turn volatility into a visual framework. Pros still rely on price action, momentum, volume and risk control. The edge comes from the complete process rather than from the indicator by itself.
Conclusion
Bollinger Bands map volatility and relative extremes. When you pair them with clear triggers, position sizing and a disciplined exit, they can guide precise and repeatable trades. Use the action map to build your routine, practice on a demo, then take the smallest possible live size while you collect data. If you need a straightforward path to implement the plan, try a demo with a broker like Exness and validate that the platform, funding routes and account options match your goals before you scale.