How to Analyze with MACD
 Sam Reid
Staff Writer
Sam Reid
Staff Writer  16th Aug 2025
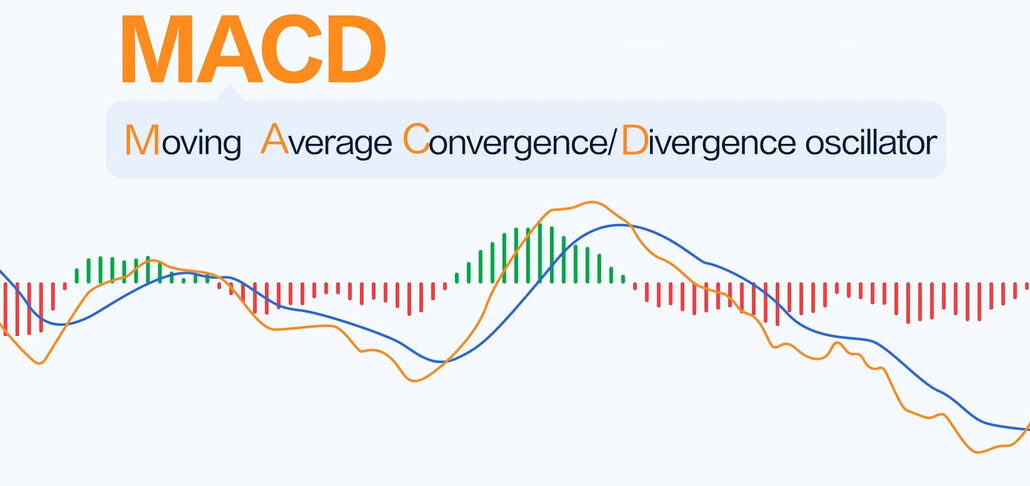
Markets move fast, and traders need reliable tools to keep pace. One of the most widely used indicators across global markets is the Moving Average Convergence Divergence (MACD). Invented in the late 1970s by Gerald Appel, MACD remains a cornerstone of technical analysis because it blends trend-following with momentum insights in a way that’s both simple and powerful. If you have ever asked yourself how to analyze with MACD effectively, the answer starts with understanding its components, knowing when signals matter, and applying it in the context of broader trading strategies.
This article will explore not only the mechanics of MACD but also how to make it practical for real trading decisions. We will review signals, divergences, and timeframes, while also looking at advanced uses like customizing settings and combining MACD with other tools. By the end, you will have a clear framework for how to properly read and trade with MACD.
Understanding the Basics of MACD
At its core, MACD is built from exponential moving averages (EMAs). These are averages that give more weight to recent prices, making them more responsive than simple moving averages. MACD calculates the difference between a shorter-term EMA and a longer-term EMA.
-
MACD Line: The 12-period EMA minus the 26-period EMA.
-
Signal Line: A 9-period EMA of the MACD line itself.
-
Histogram: A bar chart that shows the difference between the MACD line and the signal line.
These three elements work together to help traders identify momentum, potential reversals, and entry or exit signals.
How to Properly Read the MACD
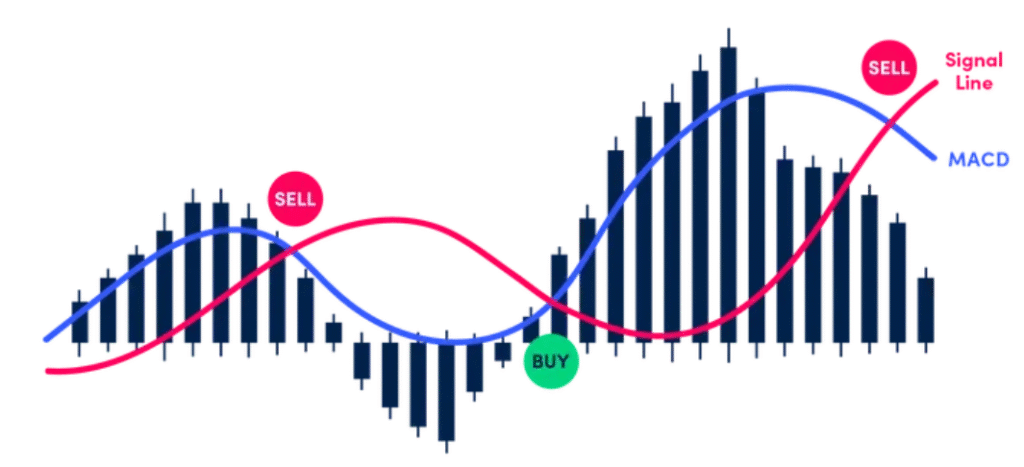
The most basic way to interpret MACD is through its crossovers and relationship with the zero line:
-
Signal Line Crossovers
-
When the MACD line crosses above the signal line, it is seen as bullish.
-
When it crosses below, it is interpreted as bearish.
-
-
Zero Line Crossovers
-
A cross above zero suggests bullish momentum is strengthening.
-
A cross below zero points to bearish momentum.
-
-
Histogram Analysis
-
A rising histogram above zero suggests strong bullish momentum.
-
A falling histogram below zero indicates deepening bearish strength.
-
Understanding these signals is essential for figuring out when to buy and sell using MACD, but traders should not stop there. Context matters, and MACD signals are far more reliable when combined with broader market structure.
When to Buy and Sell Using MACD
MACD signals can appear often, but not all of them should be acted on. The strongest trade opportunities usually arise in three contexts:
-
Trend Continuation
-
If the broader trend is bullish, and MACD crosses above the signal line after a short pullback, that often marks a good buy point.
-
If the trend is bearish, and MACD crosses below after a brief rally, it can be an effective sell trigger.
-
-
Divergence as a Warning Signal
-
Bullish divergence occurs when price makes new lows but MACD makes higher lows. This suggests selling pressure is fading, often before a rally.
-
Bearish divergence happens when price makes higher highs but MACD makes lower highs, a warning that momentum is weakening.
-
-
Rapid Expansions
-
When the MACD line moves far away from the signal line, momentum has expanded sharply. This often precedes a short-term retracement, creating exit or reversal opportunities.
-
The Best Strategy for MACD
While MACD can be used alone, most professional traders integrate it into broader systems. Here are strategies that go beyond simple crossovers:
1. MACD with Support and Resistance
MACD signals are more reliable when they align with key market levels. For instance, a bullish crossover near a strong support zone is stronger than the same signal in the middle of a trading range.
2. MACD with RSI
The Relative Strength Index (RSI) measures overbought and oversold conditions, while MACD measures momentum shifts. Using both together reduces false signals. A bullish MACD crossover supported by an RSI moving up from oversold conditions is particularly powerful.
3. MACD with Multiple Timeframes
Short-term MACD signals are more reliable if they align with higher timeframes. For example, a bullish MACD signal on a 15-minute chart is far more trustworthy if the 4-hour MACD also supports an uptrend.
4. Adjusting MACD Settings
Default settings (12, 26, 9) are widely used, but they may be too slow for active traders. Alternatives include:
-
8, 21, 5 for more responsive signals.
-
3, 10, 16 for very short-term trading.
Experimenting in a demo environment helps traders find values that suit their style and instruments.

What Are Good MACD Values?
Good MACD values depend on the market, timeframe, and style of trading. The traditional 12, 26, 9 works well for daily stock charts. Forex traders and day traders often prefer faster settings like 8, 21, 5 because they provide earlier signals. However, faster settings can create more false alarms.
The best practice is to test different values in a simulated environment, compare them against historical data, and find the balance between responsiveness and accuracy that matches your strategy.
Strengths and Limitations of MACD
Like every indicator, MACD has pros and cons.
-
Strengths:
-
Versatile: works across stocks, forex, crypto, and commodities.
-
Simple: provides visual clarity on trend and momentum.
-
Reliable: divergence signals often precede major reversals.
-
-
Limitations:
-
Lagging nature: signals confirm after price has already moved.
-
Vulnerable to whipsaws: during sideways markets, MACD generates unreliable signals.
-
Requires confirmation: best when paired with other indicators or market analysis.
-
Advanced Uses of MACD
Divergence Trading
Many traders focus on divergence between price and MACD to anticipate reversals. A classic setup is when price forms a double top while MACD forms lower highs, warning of fading momentum.
Double Tops and Bottoms
MACD often helps validate candlestick patterns like double tops and double bottoms. If MACD fails to confirm the pattern, traders may avoid taking the trade.
Customization by Asset Class
Some instruments respond better to different MACD configurations. For example, high-volatility cryptocurrencies may benefit from faster settings, while long-term investors in equities may prefer the slower defaults.
Practical Example of Analyzing with MACD
Imagine analyzing a stock trending upwards. Price pulls back to a support area, and MACD dips below zero. Soon after, the MACD line crosses above the signal line while the histogram rises. This alignment of support, positive MACD momentum, and histogram confirmation creates a high-probability buy setup.
Conversely, if a cryptocurrency rallies strongly, forms a higher high, but MACD makes a lower high, that bearish divergence suggests exhaustion. Traders could use this signal to exit or prepare for a short position.
FAQs
How to properly read the MACD?
Read MACD by monitoring crossovers of the MACD line and signal line, zero line shifts, and histogram movement. Combine these signals with market context to improve accuracy.
When to buy and sell using MACD?
Buy when the MACD crosses above the signal line during an uptrend or after divergence signals weakening selling pressure. Sell when it crosses below during a downtrend or after bullish exhaustion.
What is the best strategy for MACD?
The best strategies pair MACD with support/resistance levels, RSI, or higher timeframe confirmation. Adjusting settings to match your trading style can also improve results.
What are good MACD values?
The standard 12, 26, 9 is good for daily charts. Shorter-term traders often use 8, 21, 5 for faster signals, while longer-term investors stick with defaults. The best values depend on the asset and timeframe.
Conclusion
The MACD is more than just a crossover tool. It is a versatile indicator that helps traders understand momentum, spot trend continuations, and anticipate reversals. Learning how to analyze with MACD requires practice, but with the right strategy, it can become one of the most powerful tools in your trading arsenal. Always remember to confirm MACD signals with broader market structure and, whenever possible, pair it with complementary indicators for a balanced approach.