Drawdowns in Trading Explained for Beginners
 Sam Reid · Senior Financial Markets Analyst
Staff Writer
Sam Reid · Senior Financial Markets Analyst
Staff Writer  02nd Feb 2026
Every trader remembers their first significant drawdown. You watch your account balance climb steadily for weeks, maybe months, feeling increasingly confident in your strategy. Then the market shifts. Your positions turn against you, and that hard-won profit starts evaporating. Within days, you’re not just back to breakeven: you’re underwater. That sinking feeling in your stomach? That’s a drawdown teaching you its first lesson.
Understanding drawdowns in trading is essential for beginners because this metric reveals something profit numbers alone can’t show you. A strategy might generate 50% annual returns, but if it subjects you to a 60% drawdown along the way, most traders will abandon it long before those returns materialize. The psychological and financial stress becomes unbearable. Learning how drawdowns work, how to measure them, and how to manage them separates traders who survive long enough to succeed from those who blow up their accounts in the first year.
The truth is, every trading strategy experiences drawdowns. Every single one. The question isn’t whether you’ll face them, but whether you’ll be prepared when they arrive. Knowing what constitutes a normal drawdown for your approach versus a signal that something has broken is the difference between staying disciplined and panic-selling at the worst possible moment.
Defining What is Drawdown in Trading
The Basic Definition of a Drawdown
A drawdown measures the decline from a peak in your trading account to the subsequent low point before a new peak is established. Think of it as the distance you fall from your highest point before climbing back up. If your account reaches $10,000 and then drops to $8,000 before eventually recovering, you’ve experienced a $2,000 or 20% drawdown.
This concept matters because it captures the actual experience of trading, not just the endpoint. Two traders might both finish the year up 30%, but if one experienced a 15% maximum drawdown while the other suffered through a 45% decline, their journeys were vastly different. The second trader faced nearly three times the psychological pressure and financial stress.
Peak-to-Trough Measurement Explained
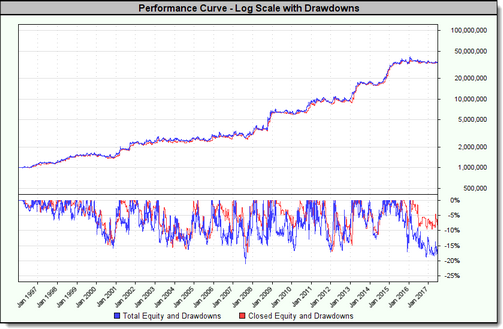
Measuring drawdowns requires tracking your equity curve over time. The peak is your highest account value to date. The trough is the lowest point reached before your account establishes a new high. The drawdown percentage is calculated by dividing the decline by the peak value.
Here’s a practical example: Your account grows from $5,000 to $12,000 over six months. That $12,000 becomes your reference peak. Markets turn, and your account falls to $9,000. Your drawdown is $3,000 divided by $12,000, which equals 25%. Even if your account later drops to $8,500 before recovering, the drawdown deepens to 29.2%. The drawdown only ends when your account exceeds $12,000 again.
Drawdown vs. Loss: Understanding the Difference
New traders often confuse drawdowns with individual trade losses, but they’re measuring different things. A loss occurs on a single trade. A drawdown captures the cumulative effect of multiple trades, winners and losers combined, over a period of declining equity.
You might have a winning percentage of 60% and still experience significant drawdowns. If your six losing trades in ten happen consecutively, your account will decline substantially even though your overall strategy remains profitable. Drawdown measures this real-world experience of sequential results, not the theoretical average. This distinction matters because surviving the drawdown period requires capital and emotional resilience that pure win-rate statistics don’t capture.
The Critical Role of Max Drawdown in Risk Assessment
Calculating Maximum Historical Drawdown
Maximum drawdown, often abbreviated as MDD, represents the largest peak-to-trough decline in your trading history or backtest results. This single number tells you the worst-case scenario your strategy has actually produced.
To calculate it, examine your entire equity curve and identify every drawdown period. The largest one is your max drawdown. If you’re evaluating a strategy that’s been running for three years and experienced drawdowns of 12%, 18%, 25%, and 15%, your max drawdown is 25%. Professional traders and fund managers track this religiously because it answers a crucial question: how bad can this get?
Most trading platforms calculate this automatically, but understanding the manual process helps you appreciate what the number represents. You’re identifying the most painful period in your strategy’s history and quantifying exactly how painful it was.
Why Max Drawdown Matters for Portfolio Longevity
Max drawdown directly impacts whether you’ll still be trading six months from now. A strategy with 40% annual returns sounds attractive until you learn it comes with a 50% max drawdown. Could you watch half your account disappear and stick with the plan? Most traders honestly cannot.
Beyond psychology, max drawdown affects practical survival. If you’re trading a $50,000 account and experience a 50% drawdown, you’re down to $25,000. Now you need a 100% gain just to get back to breakeven. That’s the cruel math of drawdowns: the deeper you fall, the harder the climb back becomes.
Fund managers use max drawdown to set position sizes and determine how much capital to allocate to any single strategy. A rule of thumb suggests never allocating more capital than you can afford to lose at the maximum historical drawdown level, then adding a safety margin because future drawdowns often exceed historical ones.
Types of Drawdowns Every Trader Should Know
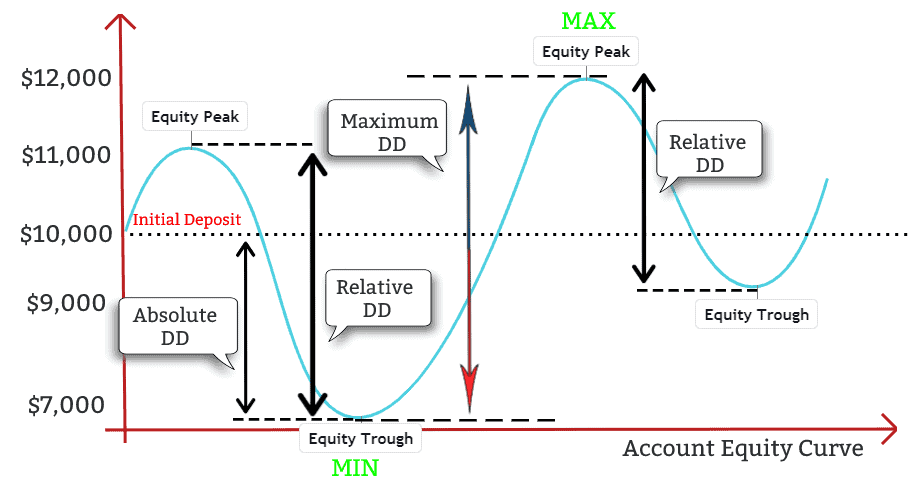
Absolute Drawdown vs. Relative Drawdown
Absolute drawdown measures the decline from your initial deposit to the lowest point your account has reached. If you deposited $10,000 and your account dropped to $9,200 at its worst, your absolute drawdown is $800 or 8%. This metric tells you how much of your original capital was at risk.
Relative drawdown, the more commonly used measure, calculates the decline from any equity peak, not just your starting balance. This provides a more accurate picture of risk because it captures drawdowns that occur after you’ve built profits. A trader who grows $10,000 to $50,000 and then drops to $35,000 has zero absolute drawdown but a 30% relative drawdown. That 30% figure better represents the actual risk experienced.
For most purposes, relative drawdown gives you more useful information. It shows the real volatility of returns regardless of when you started tracking.
Equity Drawdown vs. Balance Drawdown
This distinction trips up many beginners. Balance drawdown only considers closed trades: it measures the decline in your account balance after positions are exited. Equity drawdown includes open positions, showing the unrealized losses you’re currently sitting on.
Equity drawdown is the more honest metric because it reflects your actual financial position at any moment. A trader might show a flat balance drawdown because they haven’t closed losing positions, while their equity drawdown reveals they’re deeply underwater on open trades. This is why professional risk managers monitor equity drawdown in real-time rather than waiting for positions to close.
Watch for strategies or signal providers that only report balance drawdown. They might be hiding significant equity drawdowns by refusing to close losing positions, a practice that eventually leads to catastrophic losses.
The Psychological Impact of Trading Drawdowns
Drawdowns test your mental resilience more than any other aspect of trading. Watching profits disappear triggers powerful emotional responses: fear, regret, self-doubt, and the overwhelming urge to do something, anything, to stop the bleeding.
The psychological damage compounds as drawdowns deepen. A 10% decline feels manageable. At 20%, anxiety sets in. By 30%, many traders are questioning everything about their approach. At 40% or beyond, panic often takes over. Traders abandon proven strategies at the worst possible moment, lock in losses by closing positions at the bottom, or revenge trade trying to recover quickly.
Understanding this progression helps you prepare mentally. Before entering any strategy, ask yourself honestly: can I endure this strategy’s historical max drawdown plus another 10-15%? If the answer is no, reduce your position size until the worst-case scenario becomes tolerable.
Keeping a trading journal during drawdowns provides valuable perspective. Document your emotional state, the decisions you’re tempted to make, and whether your strategy’s rules still make sense. This record becomes invaluable during future drawdowns, reminding you that you’ve survived before and that panic-driven decisions rarely help.
Strategies to Manage and Mitigate Drawdown in Trading
Setting Stop-Losses and Position Sizing
Position sizing is your primary defense against devastating drawdowns. The math is straightforward: if you risk 1% of your account per trade, ten consecutive losers cost you roughly 10%. Risk 5% per trade, and those same ten losers wipe out 40% of your capital.
Professional traders typically risk between 0.5% and 2% per trade, with most staying closer to 1%. This might seem conservative, but it’s designed to ensure survival through inevitable losing streaks. A strategy with a 50% win rate will experience runs of six or more consecutive losses regularly. Position sizing ensures these runs don’t destroy your account.
Stop-losses enforce your risk limits mechanically, removing emotion from the equation. Set them based on technical levels or volatility measures, not arbitrary percentages. A stop that’s too tight gets triggered by normal market noise. One that’s too loose exposes you to oversized losses. Finding the right balance requires testing and adjustment.
Diversification and Asset Correlation
Trading multiple uncorrelated strategies or assets reduces overall portfolio drawdown. When your trend-following system is struggling in choppy markets, a mean-reversion approach might be thriving. When stocks decline, bonds or commodities might hold steady.
The key word is uncorrelated. Adding five stock strategies that all buy momentum breakouts provides minimal diversification because they’ll all fail simultaneously when momentum stops working. True diversification requires strategies or assets that respond differently to market conditions.
Correlation isn’t static, either. Assets that normally move independently can suddenly correlate during market crises, exactly when you need diversification most. The 2008 financial crisis saw nearly everything decline together. Build your diversification expecting correlations to increase during stress periods.
Recovering from a Drawdown: The Math of Gains
The mathematics of drawdown recovery is brutally asymmetric. A 10% loss requires an 11.1% gain to recover. A 20% loss needs 25%. A 50% loss demands 100%. And a 75% drawdown requires a 300% gain just to get back to where you started.
This asymmetry explains why professional traders obsess over limiting drawdowns rather than maximizing gains. Preventing a deep drawdown is mathematically more valuable than generating an equivalent gain. Keeping your max drawdown under 20% means recovery is always achievable within a reasonable timeframe. Let drawdowns reach 50% or beyond, and recovery becomes a multi-year project if it happens at all.
Recovery time matters as much as recovery percentage. A strategy that experiences a 25% drawdown but recovers within three months is more tradeable than one with a 20% drawdown that takes eighteen months to recover. Track both the depth and duration of your drawdowns.
When you’re in a drawdown, resist the temptation to increase position sizes to recover faster. This usually deepens the hole. Instead, stick to your original risk parameters or even reduce them temporarily. The goal during drawdowns is survival, not heroics. Markets will provide opportunities to rebuild, but only if you’re still in the game when they arrive.
Your trading future depends not on avoiding drawdowns but on managing them intelligently. Size your positions so that maximum drawdowns remain survivable. Diversify across uncorrelated approaches. Prepare yourself psychologically for the inevitable difficult periods. Track your drawdowns meticulously so you know when performance falls outside normal parameters. The traders who thrive long-term aren’t those who never experience drawdowns: they’re the ones who respect drawdowns enough to plan for them before they occur.
Disclaimer: This content is for educational purposes only and not to be construed as investment advice. Remember that forex and CFD trading involves high risk. Always do your own research and never invest what you cannot afford to lose.