Step by Step Tick Trading: How Traders Capture Moves in the Market
 Sam Reid
Staff Writer
Sam Reid
Staff Writer  01st Dec 2025
Markets move fast. Sometimes so fast that traditional charts feel like they lag behind. Traders who rely on tick trading often say it helps them spot real market activity instead of waiting for a one minute or five minute candle to finish forming. The idea is simple yet powerful. Every tick represents an actual trade. Not time passing. Real buying or selling. That makes tick charts feel more alive, more reactive, and incredibly useful for day traders who want precision.
In this beginner friendly guide, we explore what tick trading means, how ticks work, why they matter, and how step by step tick trading strategies help traders capture cleaner market moves. We also include case studies, and multi market examples across forex, futures, stocks, and crypto.
Introduction to Tick Trading
Tick trading focuses on the smallest price movements happening in the market. If you want to understand real time sentiment, this is where you can see the raw flow of trades. When markets are active, ticks print fast. When they are quiet, ticks slow down. This behaviour helps traders adjust their approach based on what the market is truly doing. It is a practical way to interpret momentum, pressure, and flow without waiting for time based candles.
What Is a Tick in Trading?
A tick is the smallest possible change in price. If EURUSD moves from 1.08500 to 1.08501, that single increment is a tick. If crude oil futures move from 83.00 to 83.01, that is also a tick. In stock trading, a move from 150.00 to 150.01 counts as one tick. Different exchanges set different tick sizes, but the meaning stays the same across markets. Ticks measure micro movement. They show how much price is shifting at the smallest allowed step.
Tick movements influence how traders plan entries and exits. They also shape how the order book behaves. When you watch ticks closely, patterns begin to emerge. A series of quick upticks reveals strong buying. A burst of downticks highlights aggressive selling. Beginners notice these things early and often say tick charts make the market feel more intuitive.
Tick Size Explained
Tick size defines how big a single tick is. In forex, a tick can be one pip or a fractional pip depending on the broker. In US equities, the standard tick size is one cent. Futures contracts such as the E mini S&P often move in larger tick increments like 0.25 index points. Crypto exchanges set their own tick sizes based on liquidity and volatility. With so many markets operating differently, understanding tick size is a core part of tick trading strategies.
Historical Context of Tick Size
Years ago, US stocks moved in fractions like 1/8 or 1/16. This made pricing less transparent. When decimal pricing began, spreads became tighter and trading became more precise. Other global markets followed similar transitions. Today, regulators set tick sizes to help keep markets efficient and stable. Even beginners benefit from this structure because price movements become easier to understand and follow.
Tick Value and Tick Direction
Tick value shows how much one tick is worth. For example, in E mini S&P futures a single tick often equals 12.50 USD. In CFDs or forex, the value depends on position size. Tick value helps traders calculate risk more accurately. If you know one tick is worth 5 USD at your size, then a twenty tick move equals 100 USD. This simple calculation supports more disciplined position management.
Tick direction shows whether price moved up or down. Upticks reflect buyers stepping in. Downticks reflect sellers taking control. When ticks alternate rapidly, the market is active but undecided. When they lean consistently in one direction, momentum builds. Observing these shifts makes it easier to read short term sentiment.
How Tick Trading Works in Practice
Tick trading is not complicated once you understand the flow. It is simply reading and reacting to the smallest movements happening in real time. Let us take a fictional example. Imagine BTCUSD pushing toward a round number like 100,000. On a one minute chart, a candle might look steady. But on a 200 tick chart, rapid upticks reveal increased buying pressure well before the next candle prints. Traders who understand tick behaviour can act earlier, with more confidence.
The same applies to forex. When EURUSD hesitates near a support level, a sequence of slower tick prints suggests falling interest. Then, if ticks suddenly speed up in one direction, that shift can signal an early move. This is why many day traders rely on tick charts for fast decision making.
Characteristics That Shape Tick Behaviour
- Liquidity
- Volatility
- Session timing
- Order book density
Psychological Impact of Tick Size
Tick size influences how traders feel about the market. Smaller ticks can make movement appear constant, which sometimes encourages overtrading. Larger ticks slow the pace and provide clearer structure. Recognising how this affects your behaviour helps you stay disciplined.
Confidence in Quick Decisions
Beginners often grow more confident when ticks give frequent feedback. The rapid pace feels engaging, especially on active markets like NASDAQ or crypto.
Overtrading Temptation
Small ticks can create the illusion that every movement is important. It takes practice to differentiate noise from real shifts in sentiment.
Stability with Larger Tick Sizes
Bigger ticks create cleaner steps between prices. This helps traders notice structure more easily.
Perception of Risk
Fast printing ticks can make a market feel chaotic. Slow ticks can make a market feel calmer. Knowing this helps you avoid emotional trading.
What Is a Tick Chart in Trading?
A tick chart prints a candle after a certain number of completed trades. For example, a 200 tick chart prints a candle every 200 trades. If the market is busy, candles form quickly. If the market is slow, candles take longer. This makes tick charts feel dynamic and responsive. Many traders consider them the best tick chart for day trading because they show micro structure clearly.
Tick Charts vs Time Based Charts
Time based charts print candles every minute or hour, regardless of activity. Tick charts react only to trades. This gives a more accurate view of real participation.
Benefits of Tick Charts
- They filter noise during quiet periods.
- They intensify during active moves.
- They help confirm breakouts earlier.
- They visually highlight momentum shifts.
How Tick Charts Work
Every time the set number of trades completes, the chart prints a new candle. That candle shows open, high, low, and close just like any other chart. What changes is the timing. A surge in activity produces more candles and clearer signals.
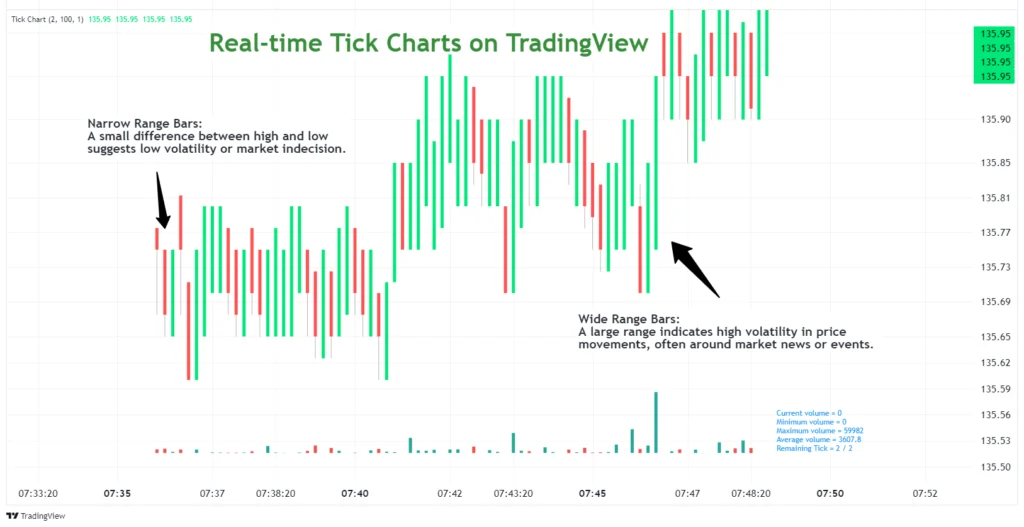
How to Read Tick Charts
Price Range
Tall candles show stronger movement. Short candles show hesitation.
Tick Value Flexibility
Traders choose smaller tick settings for volatile markets and larger settings for calm sessions.
Candle Representation
Each candle on a tick chart represents a fixed number of trades, not a fixed unit of time.
Pattern Trends
Breakouts, reversals, and micro pullbacks often appear earlier on tick charts than on time charts.
Tick Trading Strategies
Beginner friendly tick trading strategies often include structured steps. Below are simple examples used across multiple markets.
- Momentum bursts: Enter when rapid upticks or downticks appear after consolidation.
- Micro pullback entries: Wait for a small retracement on a fast tick chart before entering a trend.
- Breakout confirmation: Use tick acceleration to confirm breakouts on key levels.
- Mean reversion: Spot fading momentum when tick activity slows near extreme highs or lows.
Advantages of Tick Trading
Customised Trading Strategies
You can tailor your tick chart settings based on the market you are trading.
Detecting Market Noise
Tick charts remove the quiet periods that often create confusion on one minute or five minute charts.
Real Time Action Insights
Every trade matters. Price reacts to real pressure instead of time passing.
More Precise Entry and Exit Points
Traders use ticks to fine tune entries and reduce unnecessary risk.
Understanding Market Sentiment
If ticks print slowly, traders are hesitant. If ticks explode with speed, traders are committing.
Managing Tick Size Effectively
Adapting to Market Conditions
Use smaller tick sizes when markets move fast. Use larger sizes when markets slow down.
Balancing Precision and Cost
Small tick sizes help precision but may tempt more frequent trading. Larger ticks encourage patience.
Using Technology and Automation
Platforms such as MT5 and TradingView provide tick chart tools that help traders react promptly. Auto trading tools can also use tick data to refine execution. AvaTrade supports tick based charting through its integrated platforms.

Tick Size vs Tick Value
Tick size defines the minimum price increment. Tick value shows how much money that increment represents in your position. Both matter when calculating risk, planning stops, and estimating potential profit.
Market Examples
Stocks, futures, options, and crypto all have different tick structures. Understanding how each market sets tick size helps you adapt your approach and strategy.
What Tick Trading Tells You
Tick activity reveals hidden pressure that time charts miss. When ticks build rapidly in one direction, traders gain valuable insight into momentum and sentiment.
Step by Step Tick Trading Walkthrough
- Choose an active session.
- Select a tick chart (for example, 200 or 500 ticks).
- Check tick speed to gauge participation.
- Mark key micro support and resistance levels.
- Wait for a clear pattern or tick acceleration.
- Enter with a small stop relative to tick structure.
- Exit either at exhaustion or value targets.
Conclusion
Tick trading gives you a clearer view of real market behaviour. It shows where activity is building, how traders feel, and where momentum is shifting. By using tick charts, managing tick size, and applying simple step by step methods, beginners can capture cleaner moves across forex, futures, stocks, and crypto. Tick trading develops sharper timing and better overall awareness.
FAQs
What is a tick in trading?
A tick is the smallest possible price movement in a market. It represents the minimum allowed change between one price and the next.
How much money is 1 tick?
The value depends on the market and position size. In some futures contracts, one tick can equal 12.50 USD. In forex or crypto, the value depends on lot size or contract size.
What is a tick trader?
A tick trader is someone who bases their analysis on the smallest possible movements, usually using tick charts to react to real trade flow instead of time based candles.
Disclaimer: Remember that CFD trading involves high risk. Always do your own research and never invest what you cannot afford to lose.


")