What Is Volume Divergence in Trading and How It Works
 Sam Reid
Staff Writer
Sam Reid
Staff Writer  22nd Nov 2025
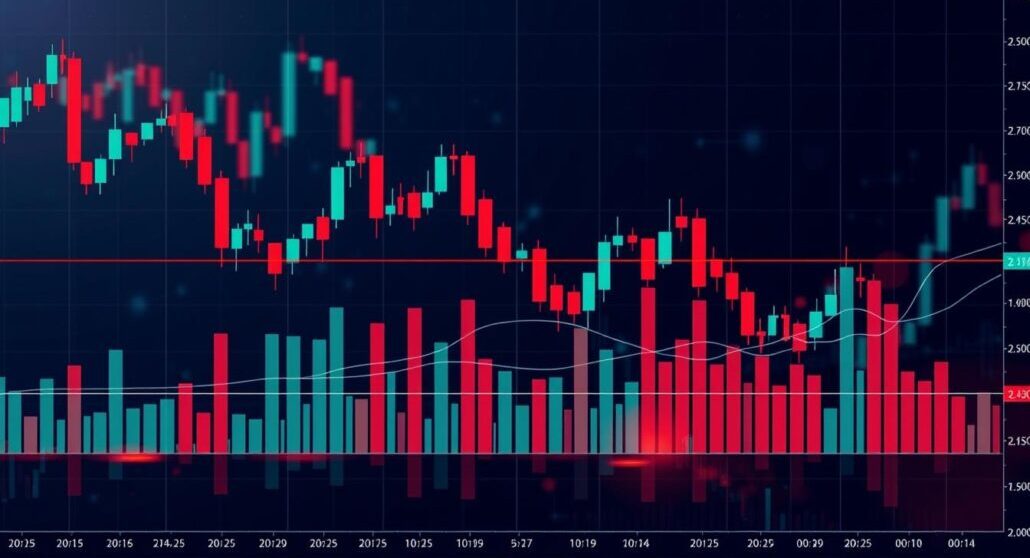
Summary of Key Insights
Many beginners first discover what is volume divergence in trading when they notice a trend slowing down even though price still climbs or falls with confidence. The shift behind the candles is often subtle, yet it carries a message that experienced traders watch closely. Volume divergence reveals when price and participation no longer agree, which helps traders prepare for potential reversals without relying on guesswork.
Volume divergence works across forex, stocks, indices, crypto, and commodities. It helps filter weak trends, anticipate turning points, and avoid chasing exhausted moves. We observed in our analysis that volume divergence is one of the simplest ways for beginners to understand when a trend is losing strength beneath the surface.
What Traders Should Know
-
Volume divergence appears when price moves in one direction while trading volume moves in the opposite direction.
-
It is a key part of what is divergence trading because it highlights weakening commitment from buyers or sellers.
-
It can improve accuracy when combined with RSI, MACD, support and resistance, and multi timeframe confirmation.
-
Learning how to use divergence in trading helps beginners avoid late entries and refine reversal setups.
Quick Example of Volume Divergence in Action
Consider gold pushing into new highs. Each new high comes with slightly lower volume. Price rises, but fewer traders participate. Soon after, gold stalls and begins to reverse downward. This is a classic bearish volume divergence and one of the most straightforward examples for beginners to recognize.
What Is Trading Volume and Why It Matters
Understanding volume is the foundation for understanding volume divergence. Trading volume represents the number of units traded within a certain period. On MT5, traders see volume in the form of vertical bars under the chart. High bars show strong activity. Low bars show weaker activity.
How Volume Reflects Market Interest
When activity is high, it means many traders agree on direction. When activity is low, it means fewer traders are committed. A trend backed by strong volume tends to be durable. A trend backed by weak volume often runs out of strength.
Volume as a Trend Strength Indicator
If an uptrend grows with rising volume, the trend is healthy. If volume begins to fall while price continues rising, the trend may weaken underneath the surface. This relationship is what creates the foundation for volume divergence. Beginners who learn this early gain a practical view of market strength rather than relying only on candle shapes.
What Is Volume Divergence in Trading
Now that we understand volume, we can explain what is volume divergence in trading. Volume divergence occurs when price and volume disagree. The price continues in its current direction, but volume fails to follow. This mismatch signals that the trend may slow or reverse.
How Price and Volume Normally Move Together
In healthy trends:
-
Price moves up with rising volume
-
Price moves down with rising volume
The shared direction shows strong participation.
When Divergence Signals Market Imbalance
Volume divergence occurs when:
-
Price makes higher highs but volume makes lower highs
-
Price makes lower lows but volume makes higher lows
When this happens, the imbalance suggests that the trend is losing internal support. We observed in our analysis that this often marks the early stages of a weakening trend.
Volume divergence becomes even more meaningful when combined with what is divergence in trading from momentum indicators like RSI and MACD. When both agree, the warning is stronger.
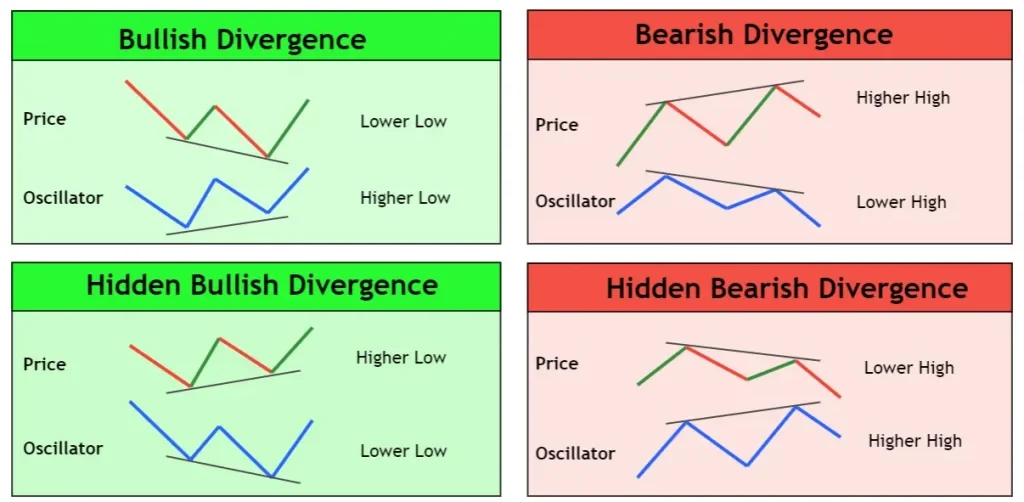
Types of Volume Divergence
Volume divergence has two main forms. Understanding both helps traders identify when to prepare for possible transitions.
Bearish Volume Divergence
Price forms higher highs.
Volume forms lower highs.
This signals buyers are losing strength.
This is one of the most common setups seen in exhausted uptrends. Many beginners mistake rising price for strong momentum, but volume divergence reveals the weakening structure underneath.
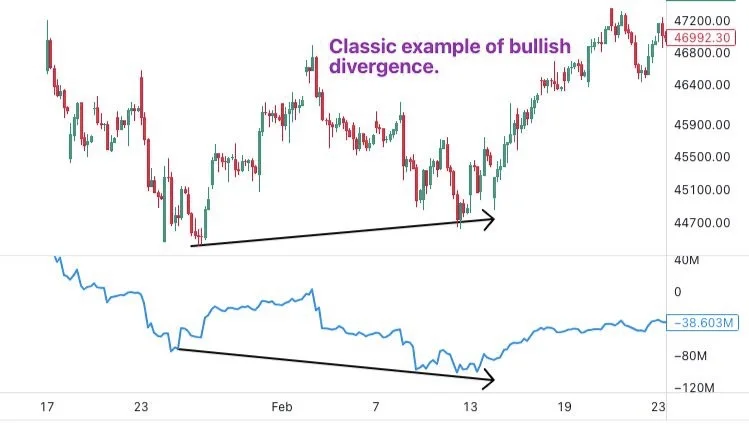
Bullish Volume Divergence
Price forms lower lows.
Volume forms higher lows.
This shows sellers are running out of strength.
Bullish volume divergence commonly appears during sharp selloffs in forex pairs, stocks, or crypto. Traders who recognize this early can prepare for potential reversals with confidence.
What Is Divergence in Trading Overall
To fully understand volume divergence, beginners should also understand what is divergence in trading from a broader technical analysis perspective.
Divergence simply means the price and an indicator are not agreeing. The concept applies to:
-
Volume
When price breaks away from the indicator direction, momentum shifts before price does. Divergence is often used to anticipate potential reversals.
Difference Between Price Divergence and Volume Divergence
-
Price divergence uses oscillators
-
Volume divergence uses raw traded volume
Both are part of what is divergence trading and both help traders spot early signs of a weakening trend.
Why Divergence Trading Can Signal Turning Points
Momentum shifts before price does. Divergence helps identify this shift. We observed in our analysis that volume divergence often appears one or two swings before the actual reversal, which gives traders time to prepare.
How Accurate Is Divergence Trading
Many beginners ask how accurate is divergence trading because they want to know whether it can be relied upon. On its own, divergence is not perfect. When combined with other confirmations, it becomes more reliable.
Strengths
-
Early warning tool
-
Works across all markets
-
Helps avoid buying into exhausted uptrends
-
Helps identify potential bottoms during selloffs
Weaknesses
-
Divergence can appear early
-
Strong trends may ignore divergence
-
Indicators can lag
Avoiding False Signals
The easiest way to increase accuracy:
-
Confirm with support or resistance
-
Use multi timeframe analysis
-
Look for clean structure
Beginners should not treat divergence as a standalone entry trigger. It is a warning that momentum is shifting, not a full signal by itself.
How to Use Divergence in Trading
Understanding how to use divergence in trading is important for beginners. Divergence becomes meaningful when combined with technique and structure.
Identifying True Divergences Across Timeframes
Beginners should avoid very small timeframes. On MT5, the best starting points are:
-
H1
-
H4
These produce cleaner, more reliable signals.
Pairing Divergence With Price Action
Divergence should be matched with:
-
Break of trendlines
-
Rejection candles
-
Pullback structures
-
Support and resistance zones
When volume divergence appears near an important zone, the signal becomes stronger.
Using Technical Indicators for Confirmation
RSI and MACD are ideal for beginners. When both show divergence and volume divergence appears at the same time, the reversal potential increases.
Tools for Divergence Analysis
On Balance Volume (OBV)
OBV measures cumulative volume flow. When price makes new highs but OBV does not, this is another type of volume divergence.
RSI and MACD Divergence Confirmation
Both indicators show momentum shifts. When combined with volume divergence, the warning is stronger.
MT5 Tools and AvaTrade
MT5 includes built in indicators that make spotting divergence easy. AvaTrade provides stable execution and reliable chart data for traders who want to build divergence based strategies.

How to Trade With Volume Divergence
Entry and Exit Rules
A reliable approach involves:
-
Identify the volume divergence
-
Confirm with price structure
-
Wait for a break of market structure
-
Enter on retests with a stop loss beyond the swing
Setting Effective Stop Losses
Stops should not be too tight. Beginners should place stops:
-
Above swing highs in bearish divergence
-
Below swing lows in bullish divergence
Trailing Stop Techniques
Trailing stops help lock in profits. Traders can trail below swing lows in uptrends or above swing highs in downtrends.
Advanced Confirmation Techniques
Volatility Filters With ATR
ATR helps measure volatility. Divergence signals are more reliable when the market is moving in a controlled, stable rhythm.
Order Block and Institutional Activity
Institutions often leave footprints at order blocks. Volume divergence that forms near these zones gains credibility.
AI Strategy Testing
Some traders use AI testing to measure divergence accuracy across hundreds of charts. This helps refine rules, although beginners are not required to use such tools.
Practical Examples of Divergence Trading
Case Study: FBS Divergence Research
We observed in our analysis that the FBS divergence study matches the behavior we have seen on MT5. The research analyzed assets such as Amazon stock on multiple timeframes. The study found that regular bearish divergence on the H4 chart predicted reversals about 62.5 percent of the time.
The key example highlighted price making higher highs while the oscillator made lower highs. This showed a weakening trend that most traders overlooked. Once support broke, a reversal followed. The conclusion of the study showed that divergence is far more accurate when combined with structural breaks.
Bullish Volume Divergence Example
Bitcoin often forms bullish volume divergence during sharp selloffs. When price makes lower lows while volume rises, buyers may be accumulating quietly.
Bearish Volume Divergence Example
A stock reaching new highs on dramatically reduced volume often reverses soon afterward. This is a common bearish volume divergence pattern.
Risk Management and Best Practices
Position Sizing
Keep risk between 1 to 2 percent per trade.
Timing and Confirmation
Divergence needs confirmation:
-
Structure break
-
Retest
-
Volume agreement
When to Ignore Divergence
If the trend is extremely strong, divergence often fails multiple times. Beginners should wait for structure confirmation.
Checklist: How to Validate a Volume Divergence Setup
-
Clear volume divergence present
-
Near support or resistance
-
RSI or MACD also showing divergence
-
Price rejected important levels
-
Trendline broken
-
Multi timeframe alignment
-
Risk kept low
-
Entry after confirmation, not before
Bullish vs Bearish Volume Divergence
| Type | Price Behavior | Volume Behavior | Meaning | Action |
|---|---|---|---|---|
| Bullish Volume Divergence | Lower lows | Higher lows | Sellers weakening | Prepare for long entries |
| Bearish Volume Divergence | Higher highs | Lower highs | Buyers weakening | Prepare for short entries |
Frequently Asked Questions
What is an example of volume divergence
An example is when EURUSD creates higher highs on MT5 while the volume histogram declines. Price looks strong, but participation is dropping. This weakening support often leads to a reversal.
What is a volume divergence
Volume divergence occurs when price and trading volume disagree. Price may continue rising while volume falls or price may fall while volume increases. This mismatch signals potential trend weakness.
What does divergence mean in trading
Divergence in trading means the price and a technical indicator or volume are moving in opposite directions. This signals that momentum may be shifting underneath the trend.
What is the 80 percent rule in volume profile
The 80 percent rule states that if price enters the value area and holds there briefly, there is a high probability that it will travel across the entire value area. Traders use this concept to anticipate directional movement inside high volume regions.
Summary and Final Thoughts
Volume divergence is one of the most practical tools for beginners to understand hidden market shifts. It helps identify weakening participation and fading momentum before price visibly changes direction. When combined with RSI, MACD, structural breaks, and disciplined risk management, volume divergence becomes a powerful part of a trading strategy.
AvaTrade and MT5 offer the tools needed to monitor volume, analyze divergence, and build a structured approach to entries and exits. With steady practice and confirmation based analysis, traders can learn to recognize volume divergence with confidence and use it to strengthen their understanding of market behavior.
Disclaimer: Remember that CFD trading involves high risk. Always do your own research and never invest what you cannot afford to lose.