What is Deliverable Percentage in Stock Market?
 Sam Reid
Staff Writer
Sam Reid
Staff Writer  09th Aug 2025
In trading, numbers tell a story. Among the many figures investors track, one often overlooked metric can offer real insight into market sentiment: the deliverable percentage. While stock prices can be volatile and volumes can be misleading, deliverable percentage gives a clearer view of how many trades are backed by actual investor intent rather than short-term speculation.
This guide will walk you through exactly what deliverable percentage means, why it matters, how to calculate it, where to find the data, and how to use it in your trading or investment decisions.
Understanding Deliverable Percentage
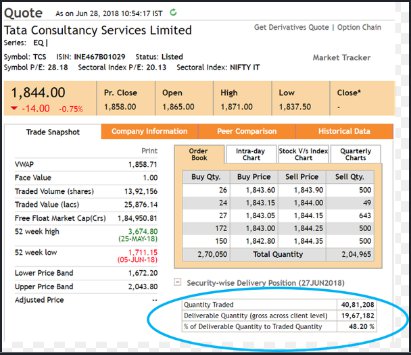
Deliverable percentage measures the proportion of traded shares that are actually transferred from the seller’s demat account to the buyer’s demat account at settlement. In other words, it tells you how many trades ended with investors taking ownership of the shares instead of just buying and selling within the same day.
This figure is expressed as a percentage and is calculated using the formula:
Deliverable Percentage = (Deliverable Quantity ÷ Total Traded Quantity) × 100
Where:
-
Deliverable Quantity is the number of shares marked for actual delivery.
-
Total Traded Quantity is the total number of shares traded in that period.
Example of Deliverable Percentage
Imagine that on a given day a stock has a total traded quantity of 100,000 shares. Out of these, 60,000 shares were taken for delivery into buyers’ accounts.
Deliverable Percentage = (60,000 ÷ 100,000) × 100 = 60%
A 60% deliverable percentage suggests that a majority of the trading volume was backed by investors who intended to hold the shares, at least for more than the trading day.
Why Deliverable Percentage Matters
Deliverable percentage is valuable because it helps you filter market noise from meaningful activity. Not all trading volume reflects long-term investor interest. Much of the daily volume in markets can be from intraday traders who do not intend to hold the stock overnight.
Here’s what deliverable percentage can tell you:
-
Investor Conviction: A higher percentage suggests more investors are willing to hold the stock beyond the day’s trading session.
-
Short-Term Speculation Levels: A lower percentage can signal that the day’s trading activity was dominated by intraday positions.
-
Market Sentiment: By tracking the metric alongside price changes, you can infer whether the market’s sentiment toward a stock is strengthening or weakening.
Interpreting Deliverable Percentage with Price Action
The real value comes from reading deliverable percentage together with price movements.
-
High Deliverable Percentage with Rising Price
This combination often points to strong buying interest from investors who believe the stock will continue to perform well. -
High Deliverable Percentage with Falling Price
Indicates that investors are still willing to take delivery even as prices drop, which could mean large holders are exiting or sentiment has turned bearish. -
Low Deliverable Percentage with Rising Price
This scenario may show a short-term rally driven by traders rather than long-term investors, so gains might be less sustainable. -
Low Deliverable Percentage with Falling Price
Suggests a decline driven mainly by traders exiting positions rather than investors selling holdings.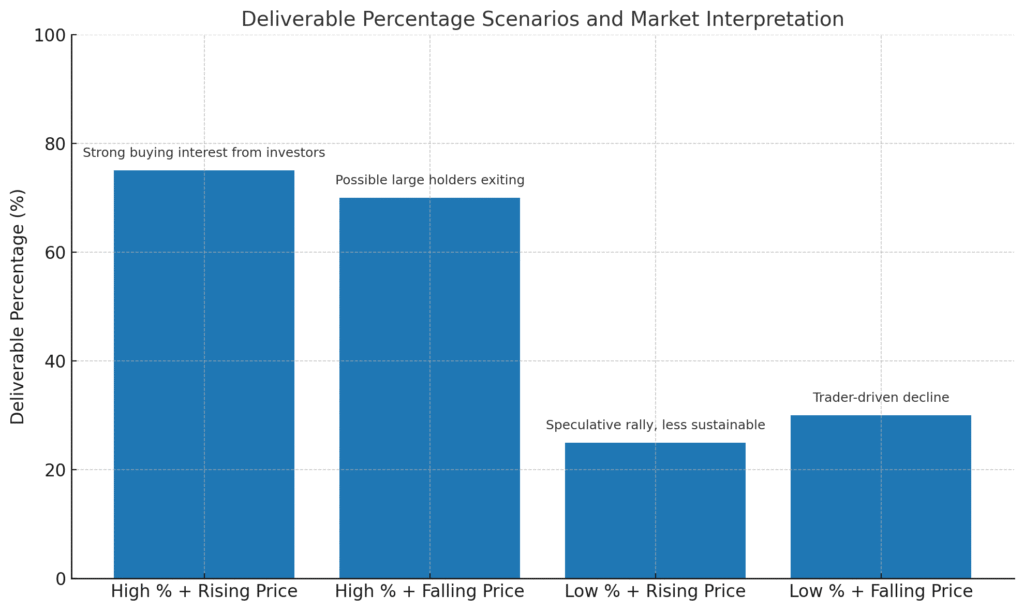
Where to Find Deliverable Percentage Data
Most major exchanges and trading platforms make this data easily accessible.
-
NSE India: The National Stock Exchange provides daily delivery data for all listed stocks.
-
BSE India: The Bombay Stock Exchange also publishes similar reports.
-
Broker Platforms: Many brokers display deliverable quantity and deliverable percentage directly on their trading terminals.
-
Market Data Websites: Sites like Moneycontrol and TradingView often show delivery statistics alongside charts.
Deliverable Quantity Example
When checking this data, it is useful to track it over multiple sessions rather than focusing on a single day. Trends over a week or month can be more telling than isolated numbers.
Practical Uses for Traders and Investors
1. Spotting Accumulation
If a stock shows a steadily increasing deliverable percentage over several sessions while prices are stable or rising, it could mean quiet accumulation by investors or institutions.
2. Confirming Breakouts
When a stock breaks out of a key resistance level, a high deliverable percentage adds confidence that the move is supported by genuine investor demand.
3. Avoiding False Signals
Sometimes a stock may show a sudden price spike but have a low deliverable percentage. This might indicate that the move is speculative and could reverse quickly.
4. Supporting Long-Term Decisions
For investors building positions, higher delivery data over time suggests that other participants share a similar long-term view.
Common Misunderstandings About Deliverable Percentage
-
It is not a standalone buy or sell signal. While the metric is useful, it works best when combined with price action, volume patterns, and broader market analysis.
-
A high deliverable percentage does not always mean bullish sentiment. If prices are falling, high delivery could be due to long-term holders selling out.
-
A low percentage is not always bad. Certain days or market conditions naturally lead to more intraday trading.
Tips for Using Deliverable Percentage Effectively
-
Track Historical Patterns: Identify how the deliverable percentage behaved during previous rallies or declines in the stock.
-
Pair with Technical Indicators: Moving averages, RSI, and volume analysis can help confirm signals.
-
Consider the Sector and Market Context: Delivery data for a stock in a hot sector may have different implications than the same figure for a stagnant one.
-
Look for Sudden Changes: An abrupt jump in deliverable percentage can signal a shift in sentiment worth investigating.
Final Thoughts
Deliverable percentage is one of those metrics that is simple to understand yet powerful when applied correctly. It filters out a lot of the intraday noise and gives you a clearer picture of real investor activity. By learning how to interpret it alongside price action and broader market conditions, you can add an extra layer of insight to your trading or investment strategy.
The key is consistency. Track it regularly, compare it to historical patterns, and use it as one piece of a broader analytical approach. Over time, you will start to see how it can help you make more informed and confident decisions in the stock market.
Disclaimer: Remember that investing and trading involves high risk. Always do your own research and never invest what you cannot afford to lose.