What Is a Fair Value Gap and How to Spot It
 Sam Reid
Staff Writer
Sam Reid
Staff Writer  10th Dec 2025
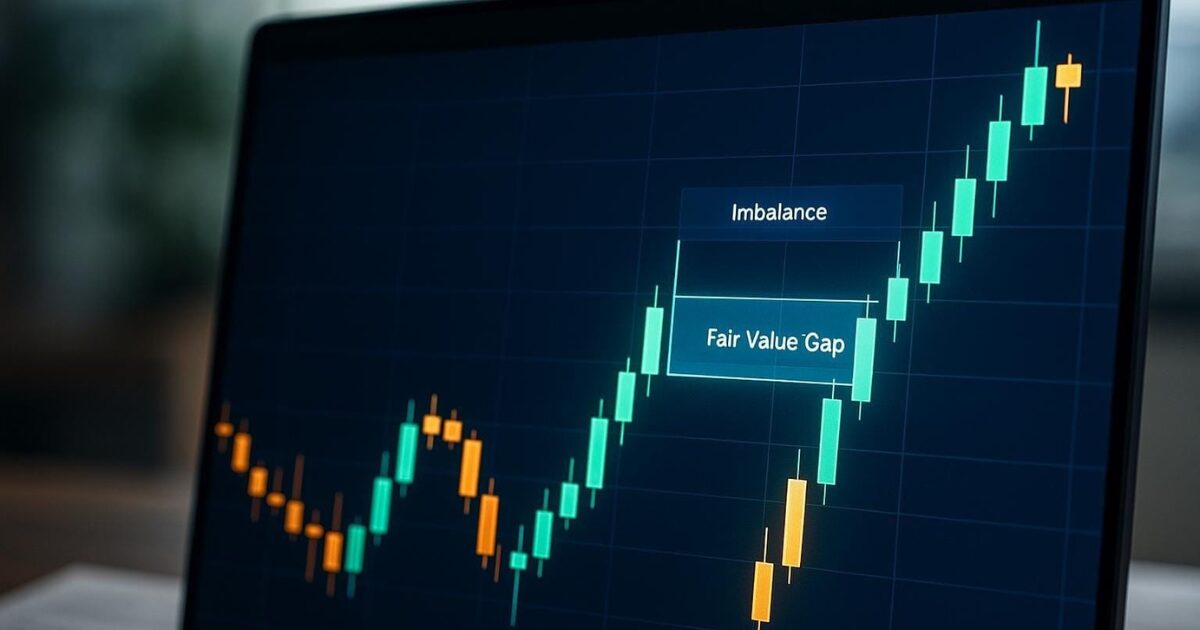
Summary
Fair value gaps are price imbalances that appear when markets move so quickly that certain price levels are skipped. By learning what a fair value gap is, how it forms, and how to trade it with clear rules, beginners can upgrade their chart reading, find better entry prices, and avoid chasing impulsive moves. This guide explains what is a fair value gap, how to identify bullish and bearish gaps, how to use inverse fair value gaps, and how to turn the concept into a structured trading plan with risk management.
What Is a Fair Value Gap (FVG)?
In simple terms, a Fair Value Gap (FVG) is a visible price imbalance on the chart. It happens when price moves so aggressively in one direction that it skips over a small area of prices without trading there. That skipped zone becomes a kind of empty pocket between two candles. Later, the market often comes back to that pocket to “rebalance” liquidity.
So, what is a fair value gap in trading? It is a technical pattern that highlights where one side of the
market, buyers or sellers, was so dominant that the opposite side had almost no chance to trade. Price shoots away, leaves a gap between candle wicks, and the market leaves unfinished business behind. Traders then use that zone as a potential area for entries, stop placement, or profit taking.
How Fair Value Gaps Form On The Chart
Most traders define an FVG using a three candle structure. Each candle plays a role in creating the imbalance.
The Three Candle Structure Explained
You can think of the pattern like this:
- Candle 1 starts a strong move, bullish or bearish. It often shows a sudden shift in momentum.
- Candle 2 continues in the same direction, extending the move and leaving some previous prices untested.
- Candle 3 finishes the structure without overlapping Candle 1’s wick. The gap between the two wicks is the fair value gap.
That space between Candle 1 and Candle 3 is the zone where price did not trade properly. It is where the market moved too fast for liquidity to keep up and not to be confused with a liquidity sweep. Many FVG strategies are built around the idea that price will often retrace into that zone before continuing in the original direction.

Why FVGs Matter In Market Structure
Fair value gaps are useful because they reveal where institutional orders might have pushed price. When a large bank or fund executes heavy orders, the market can jump quickly. The FVG is a footprint of that aggressive flow. If price comes back to the zone and reacts, it gives traders a way to enter at a more “fair” level instead of chasing a move that has already happened.
Bullish vs Bearish Fair Value Gaps
FVGs can form in either direction. The underlying logic is the same, but the location of the gap changes.
Bullish Fair Value Gaps
A bullish FVG appears in an upward move. Typically:
- Candle 1 pushes up strongly.
- Candle 2 continues higher without trading back down.
- Candle 3 also trades above, and its low does not overlap the high of Candle 1.
The gap between Candle 1’s high and Candle 3’s low is the bullish FVG. When price later retraces into that zone, traders look for signs that buyers are stepping in again. If the reaction is strong, it can be a good place to join the uptrend at a discount.
Bearish Fair Value Gaps
A bearish FVG appears in a downward move. The logic is mirrored:
- Candle 1 drops sharply.
- Candle 2 continues lower.
- Candle 3 trades below, and its high does not overlap the low of Candle 1.
The gap between Candle 1’s low and Candle 3’s high is the bearish FVG. When price retraces back up into this area, it may meet fresh selling pressure. Traders can use that reaction to enter short trades at a better price instead of selling after an extended drop.
How To Identify A Fair Value Gap Step By Step
Beginners often ask, “How do you identify FVG on a real chart?” Here is a simple workflow you can follow.
Step 1: Spot The Impulse Candle
Scan your chart for a strong bullish or bearish candle that stands out. It should be noticeably larger than recent candles and show a clear directional push.
Step 2: Check For The Three Candle Pattern
Look at the candle before and after the impulse candle. Ask yourself:
- Does Candle 2 continue in the same direction?
- Does Candle 3 leave a visible gap between its wick and Candle 1’s wick?
If there is a clear space between Candle 1 and Candle 3, you may have a valid fair value gap.
Step 3: Mark The Gap Zone
Draw a rectangle between Candle 1’s wick and Candle 3’s wick:
- Bullish FVG: from Candle 1’s high to Candle 3’s low.
- Bearish FVG: from Candle 1’s low to Candle 3’s high.
Extend that rectangle into the right side of the chart, so you can see when price comes back to it.
Step 4: Confirm It Has Not Been Filled
If price has already passed fully through the zone and traded on both sides, that FVG is considered filled. It loses strength as a potential reaction zone. Focus on gaps where price has moved away and has not yet fully traded inside the rectangle.
What Is A Inverse Fair Value Gap (IFVG)?
Many traders also ask, what is a inverse fair value gap? Inverse FVGs appear when an existing fair value gap gets broken and flips its role.
Imagine a bearish FVG above price. If price breaks through that bearish gap with a strong move, the zone can flip into a bullish area. Price may then retest it from above and continue higher. The same idea works in the opposite direction for bullish FVGs that break and flip into bearish IFVGs.
In other words, an inverse fair value gap is an old FVG that has been invalidated, then reused as a reversal or continuation area. Many smart money traders watch these flipped zones as clues that momentum has shifted.

The Theory Behind Fair Value Gaps
The core idea behind FVGs is imbalance. When heavy orders hit the market, price can jump far in one direction in a short time. Liquidity at certain prices is skipped. That skipped area is the fair value gap.
Later, as the market calms down, price often revisits those levels. Think of it as the market checking whether traders are willing to transact at that skipped zone. If buyers or sellers defend the area strongly, the original trend can continue. If they fail, that can be a sign of a deeper reversal.
FVG Trading Strategy: Entries, Stops And Targets
A well structured FVG trading plan does not rely on guesswork. It has clear entry rules, stop loss rules, and profit targets. One popular bullish example, described in a TrendSpider case study, uses a three candle imbalance that forms in an existing uptrend. Price then retraces into the gap, reacts, and resumes higher. The strategy only enters on the retracement, not on the initial spike.
Entry Conditions
- Identify a clear bullish or bearish trend on your higher timeframe.
- Wait for a three candle structure that creates a visible FVG in the direction of that trend.
- Do not enter on the impulse candle. Let price move away first, then come back to the gap zone.
- Look for a confirmation candle inside or at the edge of the FVG, such as a rejection wick or engulfing candle.
This approach avoids chasing moves. You only trade when price returns to the imbalance at a more favorable level.
Stop Loss Placement Rules
In many FVG strategies:
- For a long trade on a bullish FVG, the stop loss goes just below the bottom of the gap.
- For a short trade on a bearish FVG, the stop loss goes just above the top of the gap.
If price closes clearly beyond those boundaries, the imbalance is no longer respected. The trade idea is invalid and the stop loss protects your account.
Take Profit Targets
Common target ideas include:
- The recent swing high (for longs) or swing low (for shorts).
- The next liquidity area, such as clear support or resistance.
- A fixed reward to risk ratio, for example 2 to 1 or 3 to 1.
The TrendSpider style FVG example also ties targets to the structure created around the gap. Profits are taken near previous highs or lows, or at logical points where the trend might pause.
Multiple Timeframe Confirmation
To increase quality, you can combine different chart levels:
- Use higher timeframes, such as 4 hour or daily, to find major FVG zones.
- Drop to lower timeframes, such as 15 minute or 1 hour, to fine tune your entry when price revisits the gap.
This way, you only trade in the same direction as the bigger picture and still get precise entries.
Position Sizing And The 2 Percent Rule In Forex
Is FVG a good trading strategy on its own? It can be, but only with strict risk management. Many forex traders use the 2 percent rule. That means they never risk more than 2 percent of their account on a single trade. If an FVG tradefails, the loss is contained.
You can apply the 2 percent rule by calculating your lot size based on your stop loss distance. The wider the gap and stop, the smaller the position size needs to be. This keeps risk consistent from trade to trade.
Best Timeframes For Fair Value Gap Trading
Fair value gaps appear on every timeframe, from one minute charts to weekly charts. The best choice depends on your style and patience.
Intraday Timeframes
Scalpers and day traders often use one minute, five minute, or fifteen minute charts. FVGs on these timeframes can fill quickly, sometimes in minutes. They give many opportunities, but the noise level is high and spreads matter more.
Swing And Position Timeframes
Swing traders prefer one hour or four hour charts. These FVGs take longer to form, but often align with clear swings in price. Position traders might even watch daily or weekly FVGs created by strong news moves or macro events. These zones can remain relevant for days or weeks.
Indicators That Help Detect FVGs
You can trade FVGs manually or with the help of indicators.
Automatic FVG Indicators
Many platforms offer indicators that highlight fair value gaps automatically. They scan recent candles and draw shaded rectangles wherever a three candle imbalance appears. This is helpful if you track several markets at once.
Smart Money Concepts Tools
Some tools combine FVGs with order blocks, liquidity zones, and other smart money concepts. They show where institutions might have traded and where price could react again.
Manual Identification
If you prefer clean charts, you can simply learn to spot the three candle pattern by eye and mark the gaps yourself. The logic stays the same. It just requires a bit more practice and screen time.
Common FVG Trading Mistakes
Even a good concept can go wrong if used poorly. Common mistakes include:
- Trading every highlighted gap without checking the overall trend.
- Ignoring the fact that some FVGs form in low liquidity sessions.
- Entering the moment price touches the gap, without confirmation.
- Overleveraging because past examples looked “easy”.
How To Avoid False Fair Value Gap Signals
To filter out weaker setups:
- Trade FVGs that line up with the higher timeframe trend.
- Avoid gaps created in quiet hours when spreads and slippage are larger.
- Look for reaction, such as rejection wicks or strong candles, instead of setting blind limit orders.
- Combine FVGs with other structure elements like support, resistance, or round numbers.
FVG Trading: Advantages And Limitations
Advantages
- Clear visual pattern that is easy for beginners to learn.
- Helps traders avoid chasing moves and wait for better prices.
- Connects directly to institutional behavior and liquidity.
Limitations
- Not every fair value gap gets filled.
- Some gaps fill but continue through the zone, stopping out tight trades.
- Requires a reliable broker with good execution, especially when trading intraday FVGs.
Choosing A Broker For Fair Value Gap Trading
Because fair value gap strategies often depend on precise entries during fast moves, execution quality is crucial. You want tight spreads, quick order fills, and stable platforms when price taps into a gap and reacts. A broker such as AvaTrade, with strong execution and a wide range of markets, can give FVG traders a smoother experience than a slower or less reliable provider.

FAQs
What does a fair value gap indicate?
A fair value gap indicates that price moved too quickly through a zone, leaving an imbalance where very few trades occurred. It often marks an area where the market may later return to rebalance liquidity.
How do you identify FVG?
You identify FVG by finding a three candle pattern where Candle 1 and Candle 3 do not overlap with their wicks, and the space between them sits inside Candle 2. That space is then marked as a zone and watched for future retracements.
Is FVG a good trading strategy?
FVG can be a good trading strategy if it is combined with trend direction, confirmation signals, and strict risk management. On its own, without context, it can produce many false signals.
What is the 2% rule in forex?
The 2 percent rule in forex means you never risk more than 2 percent of your trading account on a single position. When you apply this rule to FVG setups, you limit the damage from losing trades and give your strategy room to play out over many examples.
Do all FVGs get filled?
No. Some FVGs remain open for a long time, and some never fill. That is why traders treat them as high probability zones, not guarantees, and always protect themselves with stop losses.
Can FVGs signal institutional activity?
Yes. Many traders view FVGs as footprints of institutional orders. Large, one sided moves that create clear gaps often reflect aggressive activity from big players, which is why these zones attract so much attention.
Disclaimer: Remember that CFD trading involves high risk. Always do your own research and never invest what you cannot afford to lose.