22nd Mar 2026
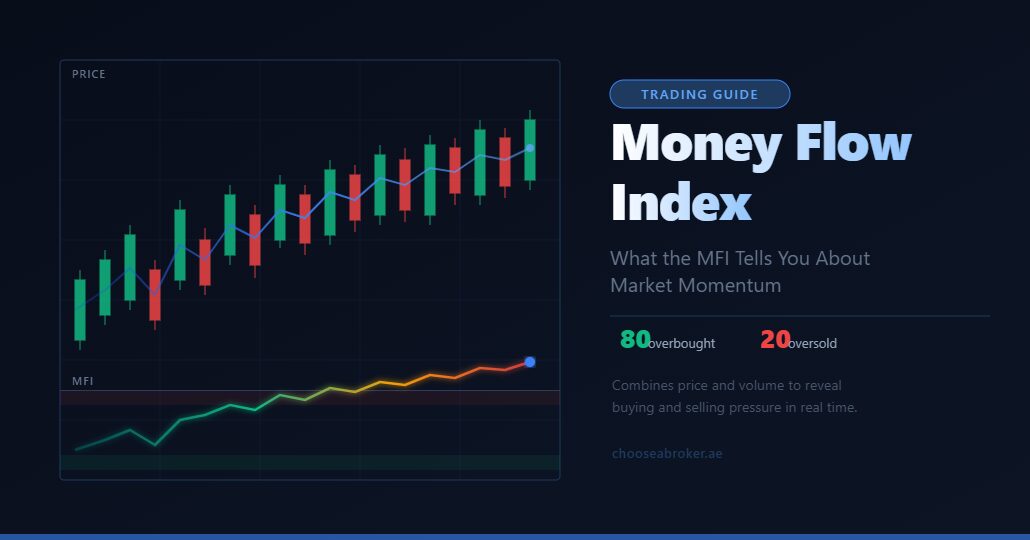
The money flow index (MFI) combines price and volume data to create one of the most reliable momentum oscillators available to UAE traders, offering crucial insights that pure price-based indicators often miss. Unlike traditional oscillators that only consider price movements, the MFI incorporates trading volume to measure buying and selling pressure, making it particularly valuable for analyzing liquid markets like major forex pairs, Dubai-listed stocks, and commodities popular with regional traders.
This volume-weighted relative strength indicator oscillates between 0 and 100, functioning similarly to the RSI but with the added dimension of volume analysis. For traders in the UAE’s diverse markets whether forex or local equities, understanding how to read and apply the MFI can significantly enhance trading decisions and risk management strategies.
How the Money Flow Index Works
The money flow index calculates the ratio of positive money flow to negative money flow over a specified period, typically 14 days. The indicator first determines the typical price for each period by averaging the high, low, and closing prices. This typical price is then multiplied by the period’s volume to create raw money flow.
When today’s typical price exceeds yesterday’s, the money flow is considered positive, indicating buying pressure. Conversely, when the typical price falls, money flow turns negative, suggesting selling pressure. The MFI then applies the RSI formula to this money flow data, creating a bounded oscillator that reveals momentum shifts with volume confirmation.
This methodology makes the MFI particularly effective for UAE traders analyzing high-volume instruments. For instance, when trading AED-denominated assets or major currency pairs like EUR/USD or GBP/USD through DFSA-regulated brokers, the MFI helps confirm whether price movements are supported by genuine market participation or represent low-volume noise.
Calculating Money Flow Index Values
The calculation process involves several steps that create a comprehensive picture of market dynamics. Raw money flow equals the typical price multiplied by volume, while positive and negative money flows are separated based on price direction. The money flow ratio divides positive money flow by negative money flow over the chosen period, and finally, the MFI applies the formula: MFI = 100 – (100 / (1 + Money Flow Ratio)).
Most trading platforms offered by regulated brokers in the UAE automate these calculations, allowing traders to focus on interpretation rather than computation. The resulting values provide clear signals: readings above 80 typically indicate overbought conditions, while values below 20 suggest oversold territory.
How to Read Money Flow Index Signals
Understanding what the money flow index tells you requires recognizing its key signal patterns and their implications for market direction. The MFI generates several distinct types of signals that UAE traders can leverage across different market conditions and timeframes.
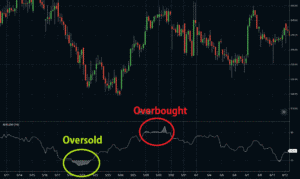
Overbought and oversold conditions represent the most straightforward MFI signals. When the indicator rises above 80, it suggests excessive buying pressure that may lead to a price reversal or consolidation. Conversely, readings below 20 indicate potential selling exhaustion and possible upward price movement. However, experienced traders know these levels alone don’t guarantee reversals. They simply highlight areas requiring increased attention.
For traders focusing on Dubai-listed stocks or regional equities, MFI readings can be particularly valuable during earnings seasons or major economic announcements when volume typically increases. The indicator’s volume component ensures that signals reflect genuine market interest rather than thin trading conditions.
Divergence Patterns in Money Flow Analysis
Divergence between price and the money flow index often provides the most reliable trading signals. Bullish divergence occurs when prices make lower lows while the MFI creates higher lows, suggesting weakening selling pressure despite falling prices. This pattern frequently precedes upward price reversals and offers attractive entry opportunities for long positions.
Bearish divergence develops when prices reach higher highs but the MFI fails to confirm with new highs, indicating diminishing buying pressure at elevated levels. This signal warns of potential downward reversals and may prompt profit-taking on long positions or consideration of short opportunities where permitted by local regulations.
UAE traders analyzing commodities like gold or oil through specialized brokers can find MFI divergences particularly useful given these markets’ sensitivity to global economic flows and volume patterns. The indicator’s volume component helps distinguish between genuine trend changes and temporary price spikes driven by news events.
How to Use Money Flow Index in Trading Strategies
Implementing the MFI effectively requires understanding its optimal applications across different trading approaches and market conditions. The indicator works best when combined with other technical tools and fundamental analysis, creating a comprehensive trading framework suitable for UAE market conditions.
Short-term traders can use MFI signals on intraday charts to time entries and exits in liquid markets. When trading major forex pairs during London or New York sessions, MFI readings above 80 or below 20 combined with key support or resistance levels often provide high-probability reversal opportunities. This approach works particularly well for scalping strategies on platforms offered by SCA-regulated brokers with tight spreads and fast execution.
Swing traders operating on daily or weekly timeframes can leverage MFI divergences to identify medium-term turning points. For example, when analyzing UAE banking stocks or regional ETFs, bearish divergence at multi-month highs combined with fundamental concerns about interest rates or economic growth may signal extended downward moves worthy of position adjustments.
Combining MFI with Price Action Analysis
The money flow index becomes significantly more powerful when combined with traditional price action techniques. Support and resistance levels gain additional significance when accompanied by extreme MFI readings. A bounce from key support becomes more likely when the MFI shows oversold conditions below 20.
Chart patterns like double tops or head and shoulders formations receive confirmation from MFI behavior. A double top formation showing bearish divergence on the MFI creates a high-confidence shorting opportunity, while head and shoulders patterns confirmed by declining MFI readings during the right shoulder often lead to substantial moves.
For cryptocurrency traders in the UAE, combining MFI analysis with key psychological levels in Bitcoin or Ethereum can improve entry timing significantly. The crypto market’s 24/7 nature and high volatility make volume-based indicators like the MFI particularly valuable for confirming genuine breakouts versus false moves.
Advanced Money Flow Index Applications
Sophisticated traders can extract additional value from the money flow index through advanced applications that go beyond basic overbought and oversold readings. These techniques require deeper market understanding but offer enhanced precision in trade selection and risk management.
Multiple timeframe analysis using the MFI provides crucial context for trade decisions. A stock showing bullish divergence on the daily chart gains additional significance if the weekly MFI also displays constructive patterns. Conversely, short-term buy signals may be avoided if longer-term MFI readings indicate underlying weakness.
This multi-timeframe approach proves especially valuable when trading through beginner-friendly brokers that offer comprehensive charting packages. New traders can gradually incorporate longer-term MFI analysis as their experience grows, building more robust trading strategies over time.
Sector and Market Analysis Using MFI
The money flow index can be applied beyond individual securities to analyze broader market trends and sector rotations. By examining MFI readings across multiple UAE-listed stocks or regional ETFs, traders can identify sectors experiencing genuine accumulation or distribution phases.
For instance, if multiple real estate stocks in Dubai show improving MFI readings alongside price strength, it may signal genuine sector momentum rather than isolated moves in individual companies. This analysis helps with portfolio allocation decisions and sector-specific trading strategies.
According to the Bank for International Settlements, volume-based indicators like the MFI can provide early warning signs of market stress, making them valuable tools for risk management during uncertain economic periods.
Common Money Flow Index Pitfalls and Solutions
Even experienced traders encounter challenges when implementing MFI analysis, particularly in the unique market conditions that characterize UAE trading sessions and regional economic cycles. Understanding these pitfalls and their solutions enhances the indicator’s effectiveness significantly.
The most frequent error involves treating MFI signals as absolute buy or sell commands rather than probability-based guidance. Extreme readings can persist longer than anticipated, especially during strong trending phases driven by fundamental catalysts. UAE traders should always consider broader market context, including oil prices, regional geopolitical developments, and global risk sentiment when interpreting MFI signals.
Low-volume periods can distort MFI readings, creating false signals that don’t reflect genuine market sentiment. This issue becomes particularly relevant during Ramadan or other periods when regional trading activity typically decreases. Traders should adjust position sizes and signal confidence accordingly during such periods.
Adapting MFI Settings for Different Markets
While the standard 14-period setting works well for most applications, different markets and trading styles may benefit from adjusted parameters. Shorter periods like 8 or 10 create more sensitive readings suitable for day trading, while longer periods such as 21 or 30 smooth out noise for position traders.
When trading through specialized gold brokers, the traditional overbought and oversold levels may require adjustment due to gold’s unique volatility characteristics and its importance in regional investment portfolios. Levels of 75 and 25 might prove more appropriate than the standard 80 and 20 thresholds.
Money Flow Index in Modern Trading Technology
Contemporary trading platforms have revolutionized how traders access and utilize money flow index analysis, with many UAE brokers now offering sophisticated tools that automate signal detection and alert generation. These technological advances make MFI analysis accessible to traders of all experience levels while providing advanced features for professional applications.
Algorithmic trading systems increasingly incorporate MFI signals into their decision-making processes, recognizing the indicator’s value in confirming volume-backed price movements. For UAE traders interested in automated strategies, understanding MFI principles becomes crucial even when not manually analyzing charts, as many expert advisors and trading robots utilize these concepts in their programming.
Mobile trading applications now provide real-time MFI calculations and alerts, allowing traders to monitor opportunities while managing other business activities—particularly important in the UAE’s dynamic commercial environment where traders often balance multiple professional responsibilities.
The money flow index remains one of technical analysis’s most valuable tools for traders seeking to understand the relationship between price, volume, and market sentiment. By mastering MFI interpretation and application, UAE traders can enhance their market analysis significantly, whether focusing on local equities, international forex markets, or alternative investments like cryptocurrencies and commodities. Success with the MFI requires patience, practice, and integration with broader analytical frameworks rather than reliance on isolated signals. Consider exploring regulated brokers that provide comprehensive technical analysis tools and educational resources to support your MFI-based trading strategies.