Liquidity Sweep Explained: Step-by-Step Rules to Catch Reversals
 Sam Reid
Staff Writer
Sam Reid
Staff Writer  14th Dec 2025
Summary
- A liquidity sweep helps explain why price often pushes beyond an obvious level and then reverses.
- Liquidity sweeps occur because stop losses and pending orders cluster around clear highs, lows, and round numbers.
- For beginners, liquidity sweeps work best as a bias-setting and confirmation tool, not as a standalone entry signal.
- This article uses a widely referenced EURUSD resistance sweep case study to explain the concept in practical terms.
Markets are often described as unpredictable, but price movement is rarely random. While indicators, news, and sentiment all influence short-term volatility, price ultimately moves because orders exist at specific levels. Understanding what is a liquidity sweep allows traders to see beyond surface-level breakouts and understand why reversals frequently occur at obvious points on the chart.
This guide is written for beginners and focuses on clarity rather than complexity. The goal is not to claim that every sweep leads to a reversal, but to explain how and why this behavior appears so often, and how it can be used carefully to improve decision-making.
Why Price Moves the Way It Does
At its core, every market transaction requires liquidity. Liquidity refers to the presence of enough buy and sell orders to allow trades to be executed without causing extreme price disruption. When liquidity is abundant, markets move smoothly. When liquidity is thin, price becomes unstable.
Price tends to move toward areas where liquidity is concentrated. These areas form naturally because traders tend to behave in similar ways. Stops are often placed above resistance or below support. Breakout entries are often placed at the same levels. Over time, these habits create visible clusters of orders.
This is where the liquidity sweep meaning becomes important. When price moves into one of these clusters and triggers a large number of orders, liquidity temporarily increases. Once those orders are filled, price may no longer have a reason to continue in the same direction, which can lead to rejection or reversal.
What Is a Liquidity Sweep in Trading?
What is a liquidity sweep in practical terms? A liquidity sweep occurs when price trades beyond a clearly visible level such as a swing high, swing low, or round number, activating stop losses and pending orders that were resting there.
This behavior often looks like a breakout at first. Price moves decisively beyond resistance or support, triggering excitement among breakout traders. However, if price fails to hold above or below the level and instead reclaims it, the move is commonly interpreted as a liquidity sweep rather than genuine continuation.
This distinction explains why many traders ask what’s a liquidity sweep versus a real breakout. The difference is not the initial push beyond the level, but what happens after. Acceptance above a level suggests continuation. Rejection and reclaim suggest that liquidity was taken without sustained follow-through.
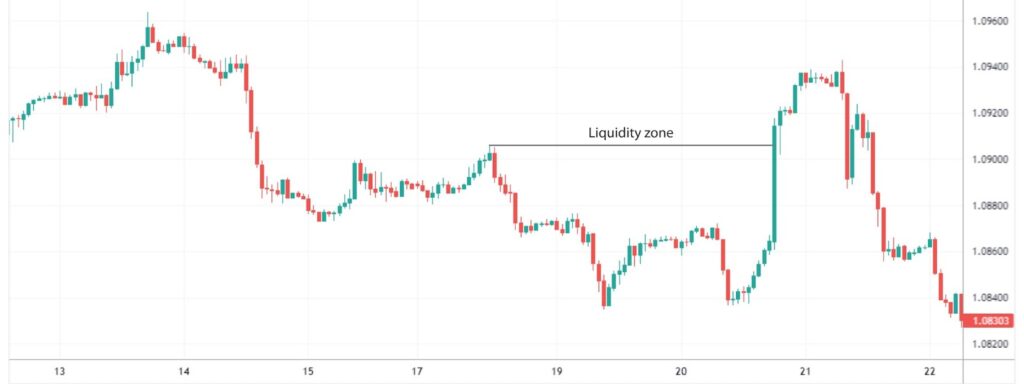
Where Liquidity Builds on a Chart
Liquidity does not appear randomly on a chart. It builds where traders consistently place orders. These locations are usually easy to spot, which is precisely why they attract so much attention.
Buy-side and sell-side liquidity
Liquidity is often described using two simple terms:
- Buy-side liquidity refers to stop losses from short positions and buy-stop orders placed above highs.
- Sell-side liquidity refers to stop losses from long positions and sell-stop orders placed below lows.
These labels do not imply intent or manipulation. They simply describe where orders are likely resting based on common trading behavior.
Common liquidity zones
- Round numbers on EURUSD such as 1.1000 or 1.1050
- Previous day high and previous day low
- Session highs and lows during London or New York
- Equal highs and equal lows that stand out visually
- Clear swing highs and swing lows on higher timeframes
These areas matter because they attract both stop losses and breakout entries, creating the conditions required for a liquidity sweep.
How Liquidity Sweeps Actually Work
When price approaches an obvious level, two groups of traders are usually involved. Traders already in positions place stop losses near the level. Traders waiting for confirmation place stop entries just beyond it.
When price trades through the level, these orders trigger almost simultaneously. This creates a surge in transactions and a temporary increase in liquidity. If price cannot attract enough new interest beyond that zone, it may reverse once the order cluster has been absorbed.
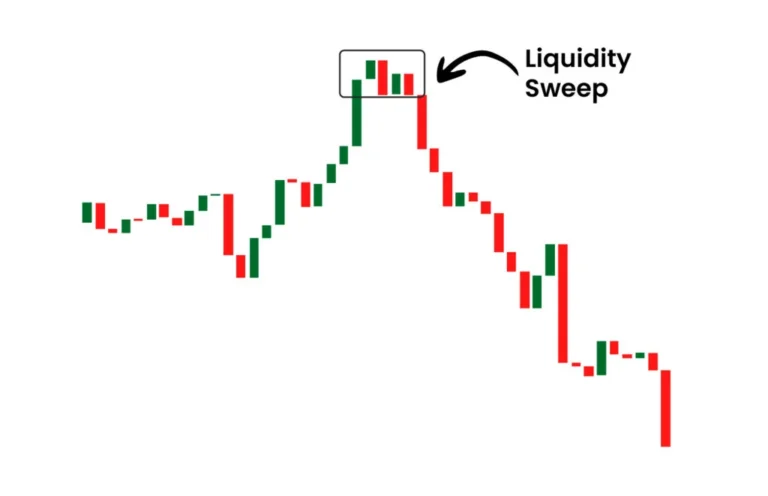
This is why liquidity sweeps are often associated with sharp spikes followed by fast rejections. The spike itself is not the signal. The failure to continue is what provides information.
Liquidity Sweep vs Liquidity Grab
Liquidity sweeps and liquidity grabs describe similar ideas but with different price behavior.
| Feature | Liquidity Sweep | Liquidity Grab |
|---|---|---|
| Duration | May span several candles | Often occurs within a single candle |
| Visual behavior | Breaks level, lingers, then reclaims | Sharp rejection with long wick |
| Interpretation | Requires context and confirmation | Suggests rejection but still needs confirmation |
For beginners, the distinction matters less than understanding that both patterns require confirmation. Neither should be traded in isolation.
How to Identify Liquidity Sweeps Step by Step
Many beginners ask how to identify liquidity sweeps without relying on hindsight. The key is to focus on behavior rather than labels.
- Mark an obvious liquidity level that most traders can see.
- Wait for price to trade beyond that level.
- Observe whether price can hold beyond the level.
- Look for a reclaim back through the level.
- Confirm direction with a shift in market structure.
This process helps avoid reacting to every spike. It also reinforces patience, which is essential when learning price-based concepts.
Step-by-Step Rules to Trade a Liquidity Sweep Reversal
The following rules are principle-based and designed for beginners. They are not guarantees, but they help filter low-quality setups.
- Select a clear and widely visible liquidity level.
- Require price to trade beyond that level.
- Avoid entering during the initial break.
- Wait for rejection and reclaim.
- Confirm with a break in market structure.
- Place invalidation beyond the sweep extreme.
- Target the next logical liquidity area.
These steps shift focus from prediction to confirmation.
When a Liquidity Sweep Fails
Not every move beyond a level is a sweep. Failure conditions are important for risk control.
- Price never reclaims the level.
- Structure does not shift.
- Momentum continues strongly in the breakout direction.
- Market conditions are thin or erratic.
Ignoring these conditions often leads to premature entries.
Liquidity Sweep Case Study: EURUSD at 1.1000
The following is a commonly referenced educational case study used to explain liquidity sweeps in forex markets.
Case study context
EURUSD consolidates below the round-number resistance at 1.1000. This level is widely watched. Short sellers often place stop losses just above resistance, while breakout traders place buy-stop orders in the same area, commonly around 1.1010.
The liquidity event
Price pushes above 1.1000 and trades into the 1.1010–1.1012 region. This move triggers clustered buy stops and stop losses, creating a burst of buying liquidity.
Rejection and reversal behavior
After the stops are triggered, price fails to sustain movement above resistance. It rejects and returns below 1.1000. This failure to hold above the level suggests that the move was driven by liquidity rather than genuine demand.
Trading interpretation
- The initial break above resistance is not treated as confirmation.
- Bias shifts only after price reclaims below 1.1000.
- Confirmation comes from a structure shift on a lower timeframe.
- Invalidation logically sits beyond the sweep high.
- Targets often include a return to the prior range or next support.
Execution Considerations for Beginners
Liquidity sweeps require patience and reliable execution. Beginners benefit from stable trading platforms and consistent order handling when learning price-based strategies.
Many new traders choose regulated brokers such as AvaTrade for major pairs like EURUSD due to transparent pricing, strong regulation, and user-friendly platforms. While broker choice does not guarantee success, execution quality becomes important when trading around key levels.

Checklist: How to Check Liquidity Sweep
- Is the level obvious?
- Did price trade beyond the level?
- Did price reclaim the level?
- Did market structure shift?
- Is there a clear invalidation point?
- Is there a logical target?
Are Liquidity Sweeps Real?
The behavior described by liquidity sweeps is observable across markets. Price frequently trades beyond obvious levels and then reverses. However, not every sweep leads to a reversal, and not every reversal begins with a sweep.
The concept is most useful when treated as a contextual tool rather than a guarantee. It encourages patience and confirmation instead of reaction.
The Bottom Line
A liquidity sweep explains why many breakouts fail and why reversals often begin at obvious levels. For beginners, the value lies in waiting for confirmation rather than reacting to the initial move. When combined with structure and discipline, liquidity sweeps can improve timing without relying on prediction.
FAQs
What is a liquidity sweep?
A liquidity sweep occurs when price moves beyond a key level to trigger clustered orders and then often reverses after that liquidity is absorbed.
Are liquidity sweeps real?
The behavior is observable, but it should be used as context rather than a guaranteed signal.
What to do after a liquidity sweep?
Wait for price to reclaim the level and confirm direction with structure before considering an entry.
How to check liquidity sweep?
Mark the level, confirm the sweep, require reclaim, and validate with structure and logical targets.
Disclaimer: This content is for educational purposes only and not to be construed as investment advice. Remember that forex and CFD trading involves high risk. Always do your own research and never invest what you cannot afford to lose.