Flag Pattern Trading Explained: How Traders Identify and Trade Momentum Continuations
 Sam Reid
Staff Writer
Sam Reid
Staff Writer  03rd Jan 2026
Flag pattern trading is one of the cleanest ways traders try to catch a trend that pauses, resets, then pushes again with momentum. When we review charts across forex, stocks, indices, crypto, and commodities, we keep seeing the same story: a strong burst of movement, a tight “breather” zone, then a continuation move that rewards patience. Flags are not magic, and they are not rare either. They are simply a repeatable structure that shows up when the market pauses without fully changing its mind.
Summary
- Flag patterns are continuation setups that form after a strong move (the flagpole) and a tight consolidation (the flag).
- The best flags are compact, slightly sloped against the prior move, and resolve with a breakout in the original direction.
- Volume behavior often supports the story: strong during the impulse, quieter during consolidation, then re-energized on breakout.
- We trade flags by defining entries, invalidation levels, and realistic targets before we place a trade.
- False breakouts happen. Risk control and confirmation matter more than spotting the pattern.
Flag Definition
A flag is a continuation pattern that forms after a sharp directional move, followed by a short consolidation that drifts slightly against the prior trend inside a tight channel. The “flagpole” is the initial impulse move. The “flag” is the pause.
what is flag pattern in trading
A flag pattern is the market taking a short break after a strong push. Instead of reversing, price compresses inside a narrow range. If the original trend resumes, the breakout can move fast because the market is already in motion and traders are watching the same boundary lines.
We treat flags like a momentum reset. The market is not asleep. It is reorganizing.
Key Takeaways
- Flags work best when they form after a clear impulse, not a messy range.
- Tight consolidation usually beats wide, choppy consolidation.
- The breakout should align with the prior trend direction.
- Plan the stop-loss first, then decide if the entry is worth it.
- Use a measured target, but stay realistic about market conditions and nearby levels.
Understanding the Mechanics of Flag Patterns
The flagpole
The flagpole is the strong, directional move that sets the tone. In practice, it often shows urgency, clean candles, and a noticeable expansion in range. This is the part that gets attention. It also creates the reason a flag can work: traders who missed the move want a second chance, and traders already in the move want a controlled pause.
The consolidation channel
The flag itself is the tight consolidation that follows. It usually forms between two parallel lines. In a bull flag, the channel often tilts slightly down. In a bear flag, the channel often tilts slightly up. The key word is tight. If it becomes wide and random, you do not have a flag. You have noise.
Volume behavior
Volume is not always available in the same way across all markets, especially spot forex. Still, the logic helps. The strongest flags often show activity surging during the flagpole, then quieting down during the consolidation. When the breakout happens, traders like to see renewed participation.
Important
From an execution and broker-review perspective, we have a simple rule: if a breakout requires perfect fills to make the trade viable, it is not a good trade. Flags can break fast. Slippage can happen. Spread widening can happen. That is why the structure and risk plan matter more than the “pretty pattern.”
How To Identify Flag Patterns
- Start with the trend: Identify a strong impulse move. If you cannot clearly point to the flagpole, stop.
- Draw the channel: Mark two parallel trendlines around the consolidation. It should look compact.
- Check the slope: The flag usually slopes slightly against the prior move.
- Watch the “character”: Clean, controlled pullbacks beat sharp whipsaws inside the flag.
- Wait for confirmation: The breakout should occur in the direction of the original trend, ideally with clear follow-through.
Our practical filter is simple: if you have to argue with the chart to make it a flag, it probably is not one.
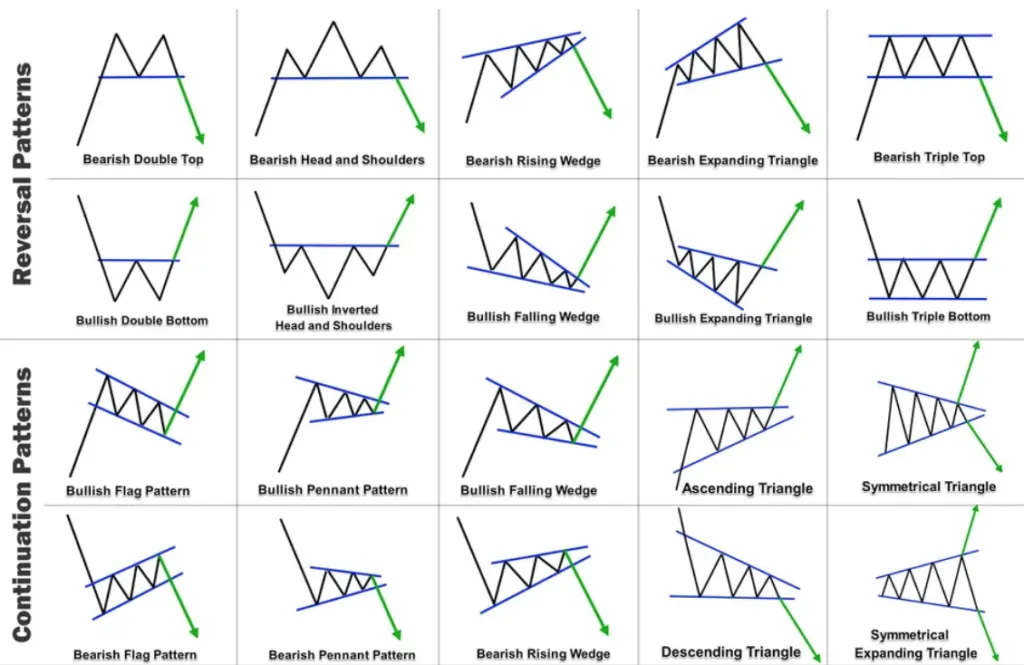
Different Types Of Flags You Should Be Aware of
Bullish Flag
A bullish flag forms after a strong upward move, then consolidates slightly downward or sideways inside a tight channel. A breakout above the upper boundary signals potential continuation.
Bullish Wedge Flag
This is a bullish continuation setup where the consolidation converges into a wedge. Volatility compresses as the lines narrow. Breakouts can be sharp, but false breaks can also appear if the broader trend is weak.
Bullish Pennant
A bullish pennant is similar to a wedge but typically forms a small symmetrical triangle after the flagpole. It often resolves quickly because the consolidation is tighter and more compressed.
Bearish Flag
A bearish flag forms after a steep decline, then consolidates slightly upward or sideways within a tight channel. A breakdown below the lower boundary signals potential continuation lower.
Bearish Wedge Flag
This bearish variant consolidates in converging lines that slope upward. If the downtrend remains intact, sellers often regain control and push price lower.
Bearish Pennant
After a sharp drop, price compresses into a small triangle. When it breaks downward, the move can accelerate because many traders treat the pennant as a continuation trigger.
How To Interpret A Flag Pattern In The Stock Market
In stocks, flags often appear around catalysts and sentiment shifts: earnings, guidance, macro headlines, sector flows, or risk-on rotations. The pattern itself is not the catalyst. It is the way traders digest the catalyst.
We interpret flags as a pause where price compresses and traders reposition. If the breakout aligns with the dominant trend and clears a meaningful boundary, momentum often returns. If it does not, the market may be signaling hesitation or a shift in structure.
Example Interpretation
Imagine a stock surges strongly over a few sessions, then moves sideways for several days between two tight parallel lines. If it breaks above that upper line and holds, traders view that as continuation pressure returning. If it breaks briefly and snaps back inside the range, that is often a warning sign of a false breakout.
Real-Life Examples of Flag Patterns in Trading
Amazon (AMZN) bull flag case study
One real-world bull flag example showed up in Amazon’s stock (AMZN) in early 2023. After a difficult prior stretch, AMZN began shifting into a more constructive phase and produced a strong upward push that formed the flagpole. As headlines and chatter around workforce reductions circulated, the stock pulled back modestly and began consolidating.
What stood out was the character of the consolidation. Price stopped falling aggressively and instead started compressing, with the range tightening and momentum cooling rather than collapsing. That pause looked more like a breather than a breakdown.
When Amazon reported fourth-quarter results on February 2, 2023, the market reaction helped drive renewed attention and participation. The breakout above the flag boundary, accompanied by stronger activity, matched what many traders look for: a clear continuation signal after consolidation. Traders who used a structured plan could place stops below the opposite side of the flag and aim for a measured continuation target based on the prior move.
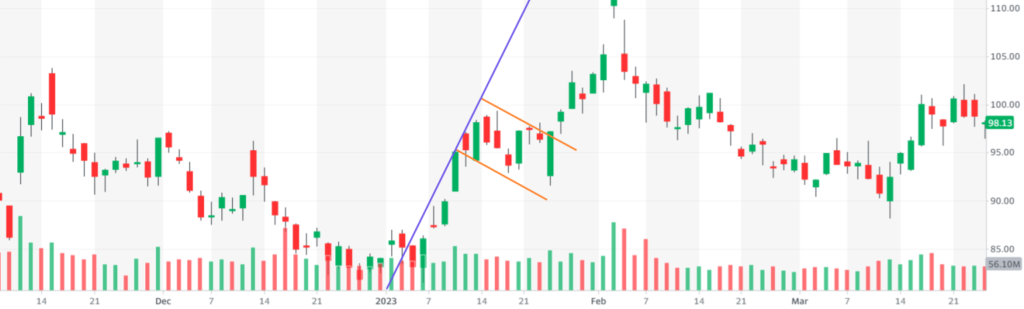
Important note: we use this case study to show pattern logic, not to claim that headlines “cause” patterns. Markets are complex. Still, the sequence is useful because it demonstrates how trend, consolidation, and breakout can appear around real events.
Practical Strategies for Trading Flag Patterns
1) Breakout entry strategy
- Identify the flagpole and the tight consolidation channel.
- Wait for a breakout beyond the flag boundary in the direction of the trend.
- Prefer a candle close beyond the boundary, especially on higher timeframes.
2) Retest entry strategy (flexible approach)
- If the breakout happens too fast, wait for a retest of the broken boundary.
- Enter only if price respects the old boundary as a new support or resistance area.
- This approach can reduce slippage risk, but it can miss trades that never retest.
3) Target projection
One common method is the measured move. Traders measure the height of the flagpole and project it from the breakout point. This creates a rational target that is tied to momentum, not wishful thinking.
4) Stop-loss placement
A practical stop is usually placed beyond the opposite side of the flag. In bull flags, that is below the lower boundary or most recent swing low. In bear flags, it is above the upper boundary or most recent swing high.
5) Position sizing with a 2% risk model
We often see traders treat stops like an afterthought. That is where flag trades go wrong. If you risk 2% per trade, your position size should be calculated from your stop distance, not from your confidence level.
- Account: $10,000
- Risk per trade: 2% (=$200)
- Stop distance: $2 per share
- Position size: $200 ÷ $2 = 100 shares
This single habit keeps your strategy alive long enough to see its edge.
What Does a Bull Flag Pattern Look Like?
A bull flag usually looks like this:
- A sharp move up that creates the flagpole
- A compact pullback or sideways drift inside parallel lines
- The consolidation often slopes slightly downward
- A breakout above the upper boundary signals potential continuation
The best bull flags feel controlled. Price cools down without collapsing.
What Does a Bear Flag Pattern Look Like?
A bear flag is the inverse structure:
- A sharp move down that creates the flagpole
- A compact bounce or sideways drift inside parallel lines
- The consolidation often slopes slightly upward
- A breakdown below the lower boundary signals potential continuation lower
Bear flags can be violent. When breakdowns happen, they can accelerate quickly, especially in risk-off environments.
how to trade flag pattern
When traders ask how to trade flag patterns, we answer with a process:
- Confirm a strong flagpole.
- Define the flag boundaries with parallel lines.
- Choose your entry method: breakout close or breakout plus retest.
- Place the stop beyond the opposite side of the flag.
- Set a target using the flagpole projection, then adjust for nearby structure.
- Size the trade so your planned loss stays within your risk limit.
how to trade a flag pattern
If you want a repeatable checklist for how to trade a flag patterns, use this:
- Trend: clear and directional
- Flag: tight, short-lived, and sloped slightly against the trend
- Break: clean push beyond the boundary
- Confirm: close beyond the line or follow-through after the break
- Risk: stop placed where the pattern is invalid
- Plan: target tied to the flagpole, not hope
How Do You Trade a Bullish Flag Pattern?
To trade a bull flag, traders typically wait for confirmation that buyers are back in control. Some enter on the breakout close above the flag. Others wait for a retest of the upper boundary. Either way, the stop is usually placed below the lower boundary of the flag, and targets are often projected using the flagpole height.
how to trade bull flag pattern
For how to trade bull flag pattern setups specifically, we keep it simple:
- Only trade if the flagpole is obvious and the consolidation is tight.
- Avoid entries inside the flag unless you are an advanced trader with a clear rule set.
- Prefer breakout confirmation on higher timeframes (4H and daily) for cleaner signals.
- Respect nearby resistance. A measured move target is great, but structure still matters.
how to trade bearish flag pattern
For how to trade bearish flag pattern setups, the same structure applies, flipped:
- Look for a sharp drop (flagpole), then a tight upward or sideways consolidation.
- Wait for a breakdown below the lower boundary before committing.
- Place the stop above the opposite side of the flag where the pattern is invalid.
- Be careful around major support levels, since breakdowns can stall or reverse.
Recognizing The Risks Associated With Trading Flag Patterns
1. False Breakouts
Price can break out briefly, trigger entries, then snap back into the flag. This is one of the most common ways flags hurt traders.
What helps: waiting for a candle close beyond the boundary or a breakout plus retest.
2. Subjective Pattern Interpretation
Traders sometimes force flags onto charts. If boundaries are unclear or the consolidation is messy, the pattern is weak.
What helps: clear rules for pole strength, flag duration, and channel tightness.
3. Extended Consolidation
If the “flag” drags on, it may stop behaving like a continuation and turn into a range, a triangle, or a different structure entirely.
What helps: treating flags as short-lived patterns and avoiding those that lose momentum.
4. Market Context Ignorance
A clean flag can still fail if it forms into major resistance, into macro event risk, or against the higher timeframe trend.
What helps: multi-timeframe alignment and awareness of key levels.
Top Trading Strategies To Take Advantage Of Flag Patterns
1. Breakout Entry Strategy
Enter after a clear break beyond the flag boundary, ideally with follow-through.
2. Target Projection
Use the flagpole height to estimate a continuation target, then adjust for nearby support or resistance.
3. Stop-Loss Placement
Place stops where the pattern is invalid, usually beyond the opposite side of the flag.
4. Multi-Timeframe Alignment
Flags that align with the 4H and daily structure often behave more cleanly than flags that fight the higher timeframe trend.
Tips And Tricks For Successfully Implementing A Flag Pattern Trading Strategy
- Trade confirmation: We prefer confirmation over anticipation. Flags punish impatience.
- Keep it liquid: Highly liquid markets reduce execution surprises.
- Do not ignore sessions: Breakouts during thin liquidity can fake out traders.
- Journal your flags: Screenshots and notes quickly show you what your “A+ flags” really look like.
- Choose reliable execution: If your broker is slow or spreads widen unpredictably, breakout patterns become harder to manage.
Brief UAE and GCC trading context
For UAE-based traders, flags often behave best during high-liquidity windows that overlap with Europe and the US. In Dubai time, that usually means the London session and the London to New York overlap. If you trade breakouts late in the day or during thinner hours, expect more noise and weaker follow-through.
Broker note: where AvaTrade fits
Because flags can break quickly, many traders prefer platforms that offer stable execution and familiar charting tools. AvaTrade is often used by retail traders for access to common markets and widely used platforms. The practical point is not the brand. It is this: breakout strategies demand reliable order handling, clear stop placement, and a platform that does not fight your plan.

FAQs
What is the difference between a bull flag and a bear flag?
A bull flag forms after an upward impulse and consolidates before a potential breakout higher. A bear flag forms after a downward impulse and consolidates before a potential breakdown lower.
How reliable is the flag pattern?
Flags can be reliable when the flagpole is strong, the consolidation is tight, and the breakout aligns with the broader trend. Even then, false breakouts happen, so risk management is essential.
How do you set targets for a flag pattern?
A common method is measuring the flagpole and projecting that distance from the breakout point. Many traders also adjust targets based on nearby support or resistance.
What timeframe is best for trading flags?
Flags appear on all timeframes. Intraday traders often use 5-minute to 1-hour charts, while swing traders may prefer 4-hour and daily charts. The best timeframe is the one that matches your risk tolerance and holding period.
How can I avoid false breakouts?
Wait for a candle close beyond the pattern boundary, consider a breakout plus retest entry, avoid thin-liquidity conditions, and keep your stop where the pattern is clearly invalid.
The Bottom Line
Flag pattern trading works when we treat it like a structured process: identify a real impulse, demand a tight consolidation, wait for confirmation, and control risk with discipline. The pattern is simple, but execution is where traders separate themselves. If we respect the structure, size the trade correctly, and stop chasing messy flags, this setup can become a reliable part of a momentum-focused playbook.
Disclaimer: This content is for educational purposes only and not to be construed as investment advice. Remember that forex and CFD trading involves high risk. Always do your own research and never invest what you cannot afford to lose.