The Best Forex Volume Indicator on MT4
 Sam Reid
Staff Writer
Sam Reid
Staff Writer  15th Aug 2025
Volume is the fuel that powers every market move. In the world of Forex, understanding volume can give traders a significant edge, especially when using the right tools on MetaTrader 4 (MT4). While no single tool works for everyone, some stand out such as Better Volume, Volume Zone Oscillator (VZO) and On-Balance Volume (OBV) for their ability to reveal market participation and trend strength.
In this guide, we will explain why volume matters, the difference between tick volume and real volume in Forex, and how to use the most effective indicators. You will also learn practical volume-based trading strategies that can help you trade with greater confidence.
Why Volume Matters in Forex Trading
Whether you are scalping, day trading, or holding positions for weeks, volume shows you market participation. High volume often accompanies strong trends or major reversals. Low volume can mean indecision or a lack of conviction behind price moves.
In Forex, you cannot track exact contract numbers like in the stock market. Instead, traders use tick volume, which counts the number of price changes during a specific period. While it does not tell you the number of lots traded, research and broker data show that tick volume correlates strongly with actual traded volume in the interbank market.
This means volume analysis in Forex is not only possible but can be extremely powerful when done correctly.
Tick Volume vs Real Volume in Forex
One of the most common debates among traders is tick volume vs real volume in Forex.
-
Tick volume measures how many times the price changes during a bar or candle.
-
Real volume measures the actual number of contracts traded, which is only available in centralized markets like stocks or futures.
In Forex, tick volume is the standard because the market is decentralized. Despite its limitations, it mirrors the rhythm of real market activity closely enough to be useful for technical analysis.
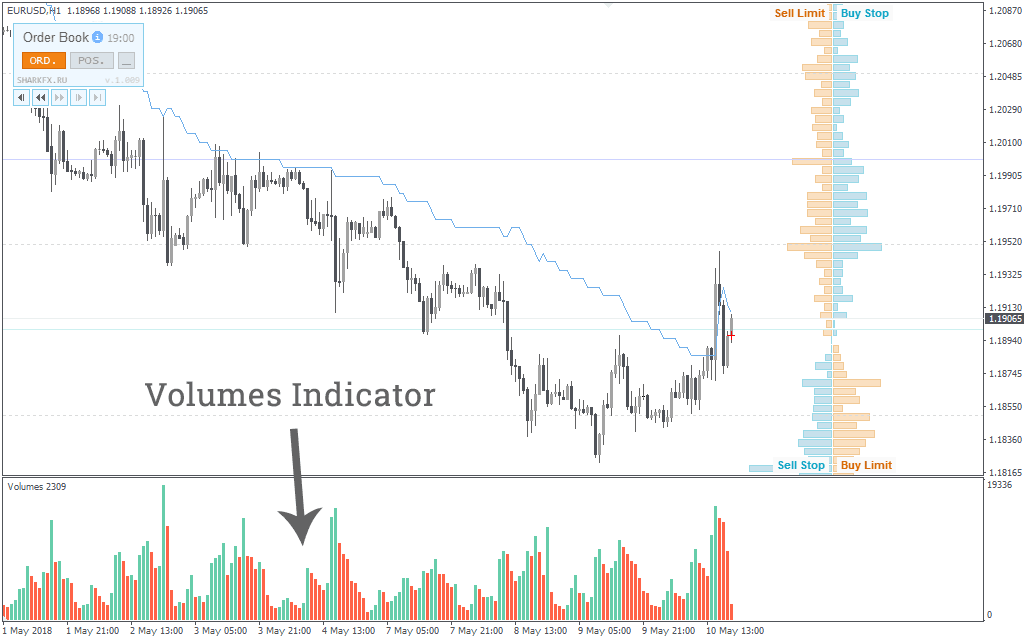
Standard MT4 Volume Indicator
MetaTrader 4 comes with a built-in MT4 volume indicator called “Volumes.” This tool shows a histogram beneath the price chart:
-
Green bars mean tick volume is higher than the previous candle.
-
Red bars mean tick volume is lower.
It is useful for spotting relative increases or decreases in activity but does not interpret what those changes might mean for the market trend. This is where more advanced tools come in.
Popular and Effective Volume Indicators for MT4
Here is a breakdown of some of the most widely used and effective options for volume analysis on MT4. These range from free tools to more advanced custom volume indicators MT4 traders often download.
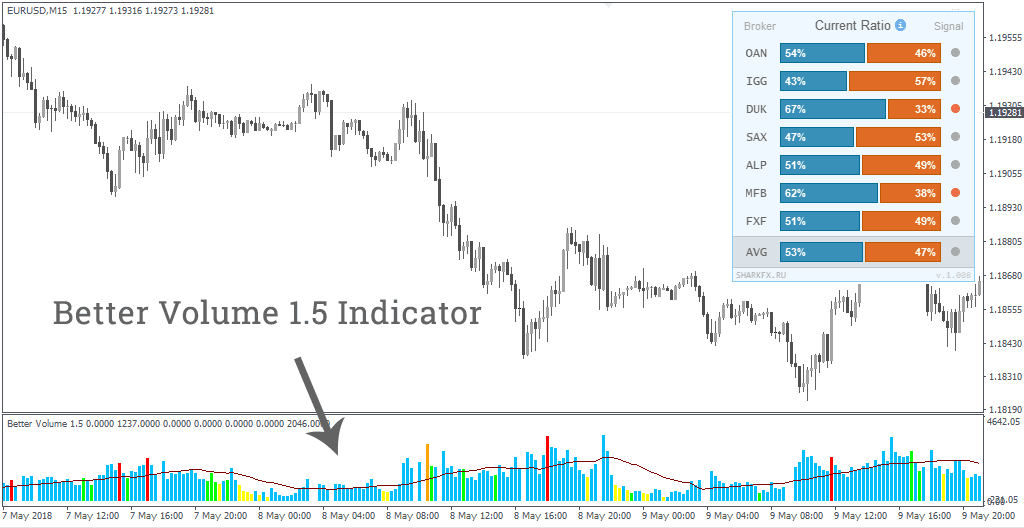
1. Better Volume 1.5 + Alerts
One of the most downloaded free Forex volume indicator MT4 tools. It color-codes bars to interpret market conditions:
-
Blue: Normal market activity.
-
Yellow: Very low volume, often near the end of a trend or retracement.
-
Green: High volume with small candle size, possibly signaling institutional activity and a coming reversal.
-
Red: Strong buyer dominance.
-
White: Strong seller dominance.
It also includes alerts and a moving average line to help identify above-average activity.
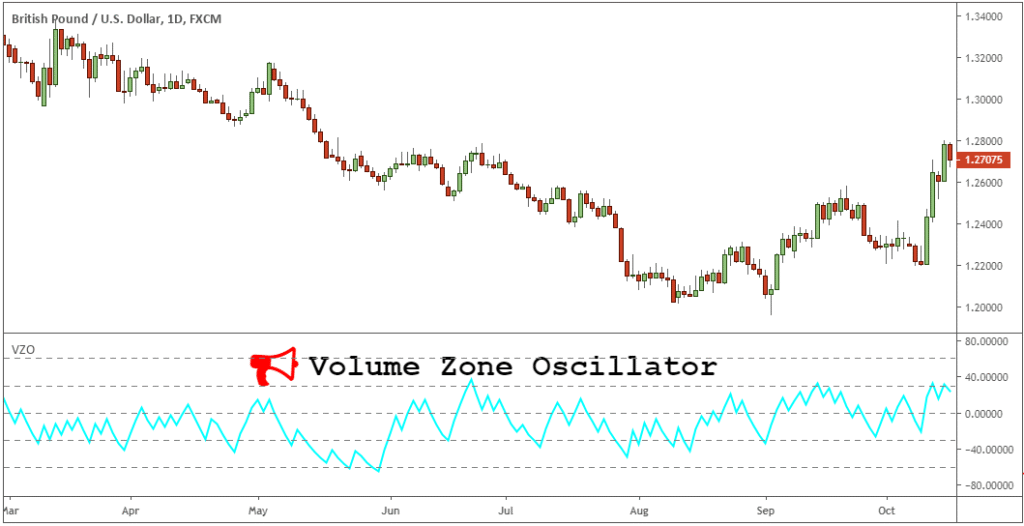
2. Volume Zone Oscillator (VZO)
VZO combines On-Balance Volume (OBV) MT4 and Money Flow Index (MFI) MT4 concepts, then smooths data with an exponential moving average. It operates between +60 percent and -60 percent, with key zones that help define bullish, bearish, and overbought or oversold conditions.
Example interpretation:
-
Above +5 percent → bullish phase.
-
Between +5 percent and +40 percent → bullish zone.
-
Above +40 percent → overbought.
-
Below -5 percent → bearish phase.
-
Between -5 percent and -40 percent → bearish zone.
-
Below -40 percent → oversold.
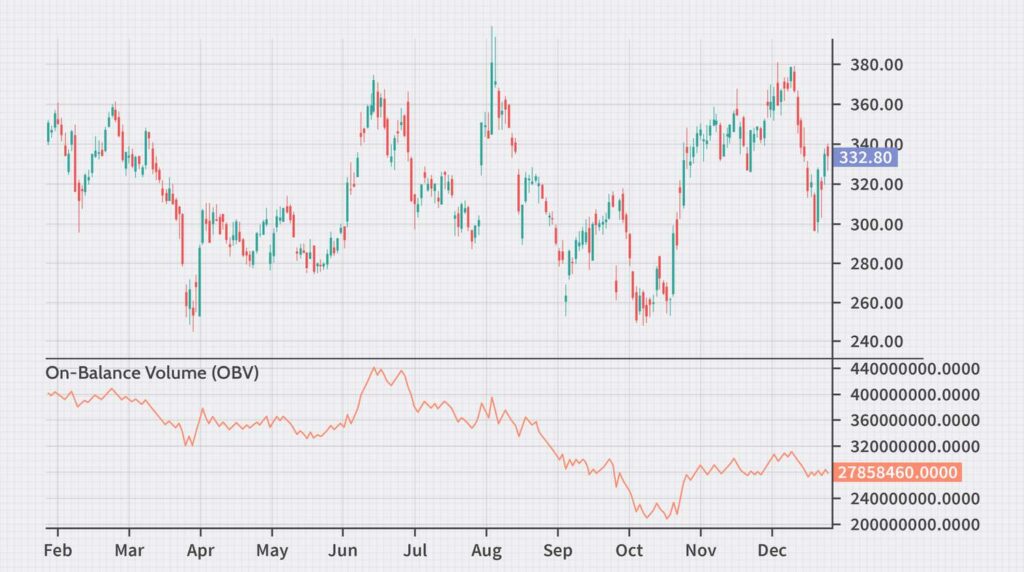
3. On-Balance Volume (OBV) MT4
This classic volume-based trading indicator accumulates or subtracts volume depending on whether the candle closes higher or lower. Rising OBV can confirm an uptrend’s strength, while divergence between price and OBV can warn of possible reversals.
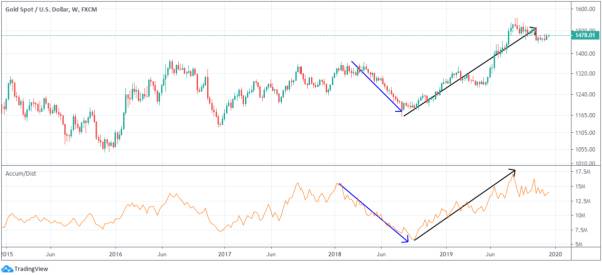
4. Accumulation/Distribution (A/D) MT4
Focuses on where the close is relative to the high-low range of the candle, weighted by volume. Helps identify whether volume is flowing into or out of a currency pair.
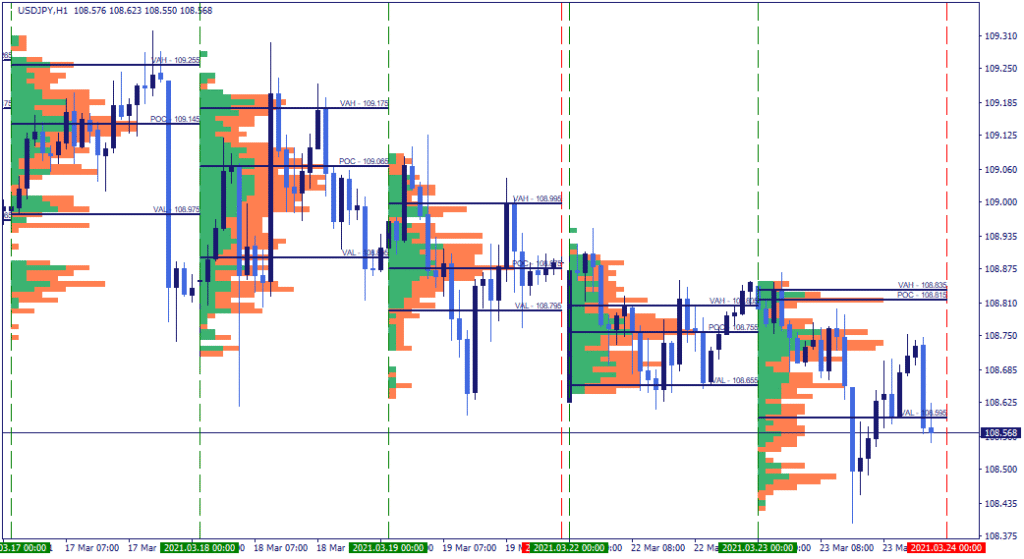
5. Volume Profile MT4
Plots volume across different price levels instead of over time. Traders use it to identify areas of high interest that can act as strong support or resistance zones.
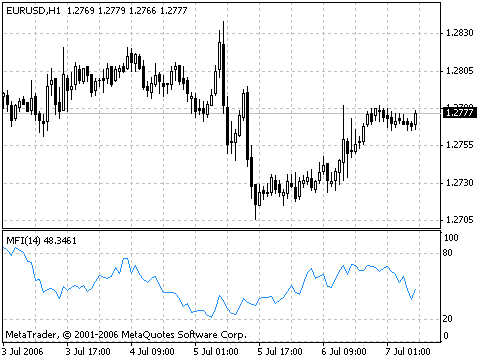
6. Money Flow Index (MFI) MT4
Combines volume and price data to identify overbought or oversold conditions. MFI above 80 suggests potential overbought conditions, while below 20 suggests oversold.
Building Volume Trading Strategies in MT4
You can combine these tools into volume trading strategies MT4 users can implement without much complexity. Here are a few ideas.
Volume Breakout Strategy MT4
-
Identify key support or resistance zones.
-
Watch for a breakout candle with significantly higher volume than recent average.
-
Confirm with OBV or VZO to ensure volume supports the breakout.
-
Set stop-loss below the breakout candle for bullish or above for bearish.
Trend Confirmation with OBV and VZO
-
Use OBV to confirm whether volume supports the current price trend.
-
Use VZO to check if the trend is in a healthy zone or approaching exhaustion.
Volume Divergence Strategy
-
Look for divergence between price and a volume-based indicator like OBV or A/D.
-
If price makes a new high but volume fails to follow, it could be a sign of weakening momentum.
How to Use Volume Indicators in MT4 Effectively
If you are wondering how to use volume indicator in MT4 effectively, here are a few tips:
-
Do not rely on volume alone; combine it with price action and support or resistance levels.
-
Use more than one type of volume indicator to confirm signals.
-
Pay attention to sudden spikes or drops in volume as they often precede big moves.
-
Always backtest your volume-based trading approach before applying it to live markets.
Broker Feed Differences in Volume Data
Volume readings can vary between MT4 brokers because each broker’s tick volume data reflects only the price changes seen on their own liquidity feed. This means that if you switch brokers, your Forex volume analysis might look slightly different. While the patterns will usually be similar, it is a good idea to stick with one broker for consistent volume studies, especially if your volume breakout strategy MT4 approach relies on precise readings.
Advantages of Using Custom Volume Indicators in MT4
While the default MT4 volume indicator is simple, a custom volume indicator MT4 can give more context, visual clarity, and even trading signals. Many traders find this improves decision-making, especially in fast-moving markets.
Benefits include:
-
Better visual cues through color coding.
-
Alerts for unusual volume changes.
-
Additional features like volume moving averages or zone readings.
Common Mistakes in Forex Volume Analysis
-
Overtrading on every volume spike. Not all spikes lead to meaningful price moves.
-
Ignoring the context. A high-volume move within a choppy market may not have the same weight as one breaking out of consolidation.
-
Using incorrect settings. Volume indicators often have adjustable periods, and choosing the wrong ones can distort signals.
The Bottom Line
Volume analysis in Forex is an underused but powerful technique. Even though we work with tick volume rather than real volume, tools like Better Volume, VZO, OBV, A/D, MFI, and Volume Profile can transform how you read the market.
By combining these with a solid understanding of price action, you can create a more complete picture of what is happening behind the candles. Whether you are looking for confirmation on a breakout, spotting the end of a trend, or identifying hidden accumulation, the best Forex volume indicator MT4 can help you trade smarter and with more confidence.
FAQs
What is the best volume indicator for Forex?
There is no single best option for everyone. Popular choices include Better Volume 1.5, Volume Zone Oscillator, and On-Balance Volume (OBV) MT4. Many traders combine them for confirmation.
What is the most powerful MT4 indicator?
It depends on your strategy. For volume-based trading, OBV and VZO are among the most reliable for confirming trends and detecting reversals.
Which Forex indicator is most accurate?
No indicator is 100 percent accurate, but combining volume analysis with price action and trend tools improves reliability significantly.
What is the real volume indicator in Forex?
Real volume is not available in spot Forex due to its decentralized nature. Tick volume is the closest proxy, and studies show it closely mirrors actual market activity.
Disclaimer: Remember that forex and CFD trading involves high risk. Always do your own research and never invest what you cannot afford to lose.