How Traders Use the Stochastic Oscillator
 Sam Reid
Staff Writer
Sam Reid
Staff Writer  20th Nov 2025
Summary
This guide explains how traders apply the stochastic oscillator to understand market momentum, evaluate price pressure, identify potential turning points, and manage entries across global markets. It covers settings, signals, divergence, trend confirmation, calculation steps, and a complete trading checklist designed to help traders use this indicator more effectively.
What Is The Stochastic Oscillator
Definition and Purpose
The stochastic oscillator is a momentum based indicator that compares the recent closing price of an asset with the high and low range of a selected period. Traders value this tool because it provides a clear view of whether price is moving with strength or losing momentum. The indicator ranges between zero and one hundred which makes it accessible to beginners while still being useful for experienced market participants.
How Traders Use It Across Markets
This momentum indicator is widely used in forex, commodities, global indices, and crypto. Traders adopt it in both discretionary and systematic approaches because it highlights subtle shifts in price pressure. In our tests across calm market sessions, the tool helped identify moments where momentum changed even before the price fully moved.
Full Stochastic Oscillator Explained
The full stochastic oscillator includes the percent K line which responds to price movement and the percent D line which is a smoother representation of percent K. Traders often use this complete version to evaluate whether price is building pressure in one direction. Many charting platforms such as MT4, MT5, and TradingView include it by default.
How the Stochastic Oscillator Works
The Logic Behind the Indicator
The idea behind this momentum tool is that in upward periods price tends to close near the highest part of the recent range while during downward periods price tends to close near the lowest part. When price begins closing away from these typical positions the indicator can show that momentum is changing. Many traders appreciate that it offers early clues rather than waiting for lagging confirmation.
Understanding Percent K and Percent D
Percent K measures the closing price relative to the high and low range. Percent D represents the average of percent K and reduces sharp fluctuations. Crosses between percent K and percent D often highlight turning points. An upward cross can signal that buying interest is returning. A downward cross may suggest weakening buying pressure or the beginning of selling interest. These relationships form the core of many stochastic strategies.
How to Read the Stochastic Oscillator
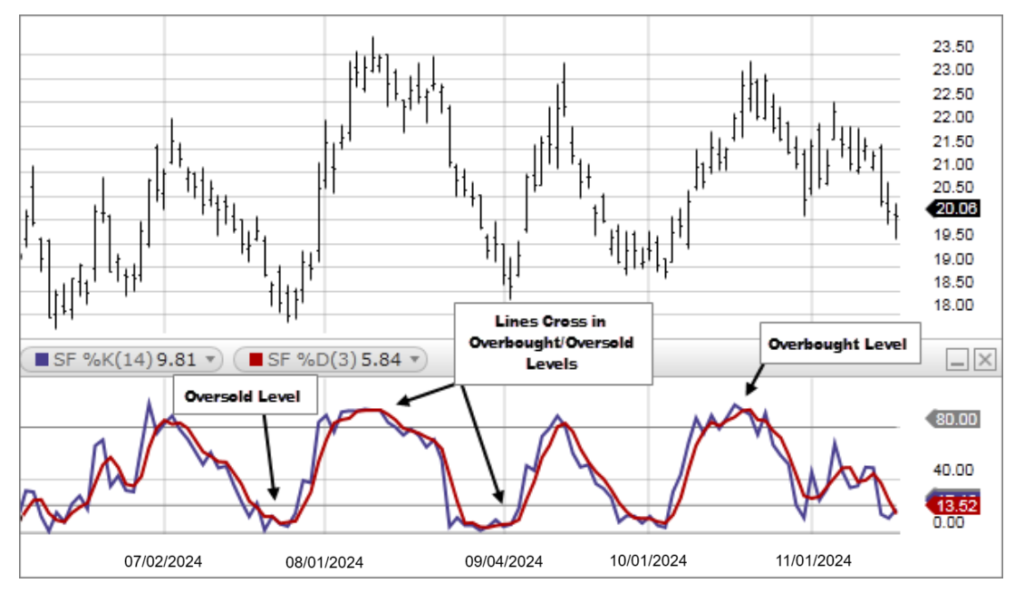
The indicator moves between zero and one hundred. Many traders interpret readings above eighty as potentially overbought and readings below twenty as potentially oversold. Our chart reviews showed that instead of reacting to static values it is more effective to focus on how the tool behaves near these regions. A sharp turn within these levels often reveals more information than the number itself.
Stochastic Oscillator Settings
Default Settings
The common setting uses fourteen periods for the lookback window and three periods for smoothing both percent K and percent D. This setup provides a balanced view of momentum while keeping the indicator responsive enough for most trading approaches.
Stochastic Oscillator Best Settings
The best settings depend on volatility. Shorter settings respond faster while longer settings filter noise. Across several of our global forex tests, fourteen with smoothing of three for both lines offered a stable configuration for swing style analysis and day trading setups.
Full vs Fast vs Slow Stochastic Oscillator
The full version provides flexibility with smoothing options. The fast version is more sensitive and reacts quickly to changes but may generate false signals. The slow version smooths the movement and reduces noise but may lag. Many traders prefer the full stochastic oscillator because it allows adjustments without changing tools.
How to Calculate the Stochastic Oscillator
Step by Step Calculation
The percent K calculation compares the most recent close with the trade range across the selected period. Percent D is simply an average of percent K. Even though platforms calculate this automatically, understanding the formula helps traders interpret momentum more precisely.
How to Calculate the Stochastic Oscillator in Excel
Excel users can calculate the indicator by creating columns for the highest high, lowest low, and closing prices then applying the percent K formula. A simple average of percent K across several rows provides percent D. This approach allows traders to backtest custom settings for specific forex pairs.
Practical Calculation Example
Imagine a selected period where the highest high is one hundred fifty, the lowest low is one hundred twenty five and the recent closing price is one hundred forty five. The percent K value would be eighty. This shows that the close sits near the top of the range which may reflect buying strength.
Using the Stochastic Oscillator in Trading
Stochastic Oscillator Strategy Overview
A common strategy uses percent K and percent D crosses to identify shifts in direction. When percent K rises above percent D after a period of weakness the tool may be signaling renewed upward momentum. When percent K drops below percent D after extended strength it may be pointing toward a potential decline. Trend context improves the usefulness of these signals.
Identifying Overbought and Oversold Levels
Traders often monitor the indicator for exhaustion signals. Oversold readings followed by upward crosses can indicate that buyers are returning. Overbought readings followed by downward crosses may signal that sellers are gaining control. The tool becomes more meaningful when it aligns with support or resistance areas.
Trend Confirmation Using the Stochastic Oscillator
This momentum indicator is also valuable when confirming trends. During upward phases a rising reading that stays supported suggests continued strength. During downward cycles a weak reading that continues to fall supports ongoing selling pressure. These confirmations help traders avoid countertrend entries that carry unnecessary risk.
Divergence Trading
Divergence occurs when price movement disagrees with the direction of the indicator. Bullish divergence appears when price makes new lows while the tool makes higher lows. This often signals weakening selling pressure. Bearish divergence forms when price reaches new highs yet the indicator produces lower highs. Divergence is one of the strongest early signals but traders should wait for confirmation candles before taking action.
Crossovers and Momentum Shifts
Crossovers between percent K and percent D give straightforward signals. An upward cross may represent a shift toward buying. A downward cross may represent a shift toward selling. Traders often combine crossovers with chart structure and moving averages to refine interpretation. Our testing suggests that the tool works best for identifying momentum shifts when the cross occurs near key zones.
Stochastic Oscillator in Forex Trading
How to Use the Stochastic Oscillator in Forex
This momentum tool is a popular choice in forex because currency pairs exhibit rhythmic movement. It helps identify momentum changes during pullbacks. On MT4, MT5, and TradingView traders often combine it with moving averages to reduce false signals. In our reviews across several forex pairs the indicator performed well in periods of stable volatility.
Forex Case Study
Consider a scenario with EURUSD. Price is trending upward and pulls back toward a support zone. The indicator falls below twenty. A few candles later percent K crosses above percent D. This shows early buying interest. Price then forms a higher low. In this case the tool helped highlight the precise moment when buyers were returning. Platforms from AvaTrade allow traders to explore similar examples through live and demo environments.
Comparing RSI and the Stochastic Oscillator
Key Differences
The stochastic oscillator and RSI measure momentum differently. This indicator compares the closing price with the high low range of the selected window. RSI measures the speed of price movements. The stochastic works better in sideways environments. RSI tends to work better when price moves in clear directional trends.
| Indicator | Optimal Environment | Strength | Weakness |
|---|---|---|---|
| Stochastic Oscillator | Sideways markets | Identifies early momentum changes | Can produce false signals in strong trends |
| RSI | Trending markets | Measures strength of directional moves | Extreme readings may persist for long periods |
Origin and Evolution of the Stochastic Oscillator
The stochastic oscillator was created by George Lane who studied how momentum often shifts before price changes direction. His work shaped modern momentum analysis. Today traders across global markets still rely on this tool because of its clear structure and wide availability on all major charting platforms.
Limitations of the Stochastic Oscillator
The indicator can produce false signals especially in volatile sessions or when news events distort movement. Traders can improve accuracy by combining it with trend filters, support and resistance levels, or moving averages. The tool also performs better when the market follows a stable rhythm.
Trader Checklist for Using the Stochastic Oscillator
- Identify the broader direction before using the indicator.
- Look for percent K and percent D crosses at key price areas.
- Check for divergence between the price chart and the momentum tool.
- Avoid relying on this indicator during chaotic conditions.
- Use multiple time frames to confirm the signal.
- Test different settings based on volatility.
- Use the tool with support and resistance zones.
- Practice each technique in a demo environment.
Frequently Asked Questions
What Is the Stochastic Oscillator
The stochastic oscillator is a momentum indicator that compares the closing price with the high low range of a selected period to highlight potential shifts in pressure.
How to Calculate the Stochastic Oscillator
The percent K value compares the recent close with the highest high and lowest low. Percent D is the average of percent K across several periods.
How to Calculate the Stochastic Oscillator in Excel
Excel users calculate this indicator by placing high, low, and closing price data in columns then applying the percent K formula and averaging the values to generate percent D.
How to Use the Stochastic Oscillator in Forex
Forex traders use this momentum tool to evaluate momentum shifts during pullbacks. A cross in low regions may signal a rebound. A cross in high regions may signal a decline.
Conclusion
The stochastic oscillator is a versatile tool for identifying momentum strength, possible reversal points, and trend continuation signals. Traders who combine it with structure, careful timing, and supportive tools can improve decision making across global markets. Consistent practice helps reveal how the indicator reacts to different environments and creates a clearer view of market pressure.
Disclaimer: Remember that CFD trading involves high risk. Always do your own research and never invest what you cannot afford to lose.


")