Breakout Trading 101: Key Concepts to Spot Market Momentum
 Sam Reid Staff Writer
Summary
Breakout trading attracts traders for a simple reason. When price bursts through a key level, markets can move fast. This guide explains what a breakout is, how breakout trading works, how to confirm a breakout, and how beginners can build a reliable approach using tools like RSI, Ichimoku Cloud, ATR, and moving averages. You will learn the steps, the signals, the common mistakes, and a real breakout example involving gold.
Introduction
“Markets spend most of their time moving sideways, but the money is often made in the moments they decide not to.”
That line has stuck with many traders because it captures the essence of breakout trading. Price can drift quietly for hours, days, or even weeks. Then one big candle appears. A level breaks. Volume spikes. Momentum kicks in. Traders who understand breakout trading know how powerful those moments can be.
This style is one of the most popular approaches among beginners and pros alike. It works in forex, gold, indices, stocks, and even crypto. It gives clear rules. It offers structure. It teaches discipline. And when used well, it helps traders catch real market momentum rather than chasing random spikes.
This guide breaks everything down in simple language so beginners can learn confidently while more experienced traders refine their strategy.
What Is a Breakout in Trading?
A breakout in trading happens when the price of an asset moves outside a well established support or resistance level. This usually comes with increased volume, stronger momentum, and a shift in market sentiment.
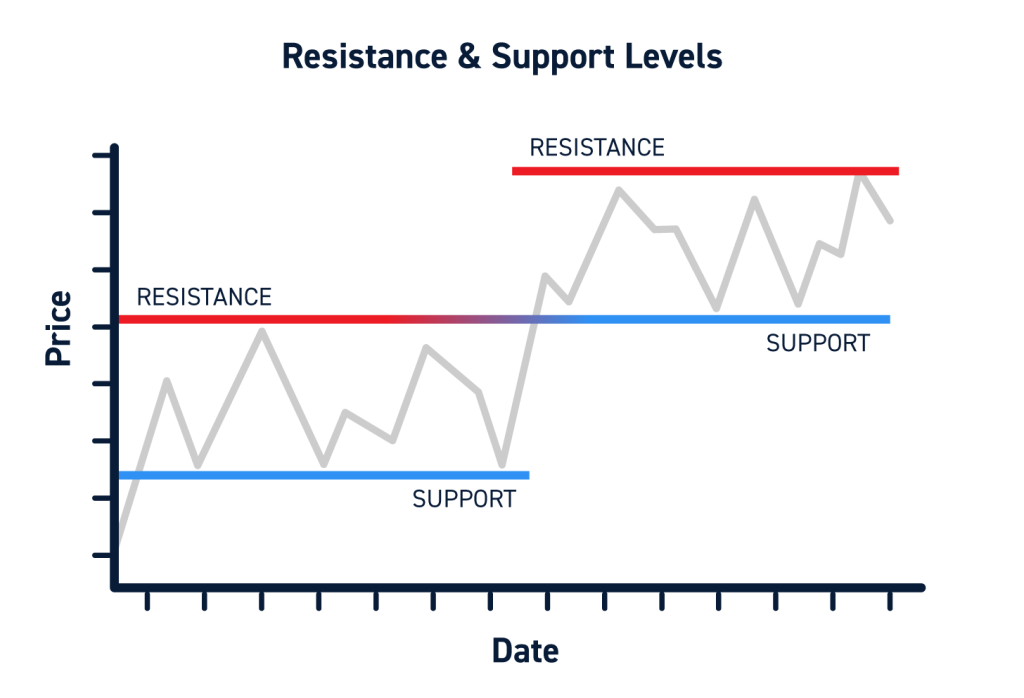
Support is like the floor where buying pressure normally holds prices up. Resistance is the ceiling where selling pressure tends to stop the price from rising further.
When price pushes through that floor or ceiling, something important is happening. Buyers or sellers are overpowering the other side. Traders call this moment a breakout, and it signals that a new move could be underway.
A breakout trading system tries to take advantage of moves that follow this moment. Traders enter as the breakout forms and hold the position until the market slows, reverses, or hits a target.
Understanding the Breakout Trading System
A breakout trading system is a structured set of rules that explains when to enter, when to exit, and how to confirm a breakout. It is designed to reduce emotion and bring consistency to the strategy.
A complete plan normally includes:
- How to identify levels
- What qualifies as a breakout
- Which indicators strengthen confirmation
- Where stops go
- How targets are set
- How to manage momentum
Beginners often feel unsure because breakouts look easy on paper but behave differently live. A clear framework helps remove confusion and keeps the trader from jumping in too early.
Support Levels Explained
A support level is an area where price tends to stop falling. Buyers step in because they believe the asset is cheap. The more times an asset touches this area and bounces, the stronger the support becomes.
Strong support increases the chance that a breakout below that level could spark a sharper downside move and offer an opportunity to trade short.
Resistance Levels Explained
A resistance level works the same way but in the opposite direction. It is where price tends to stop rising because sellers see value in taking profits or opening short positions.
When resistance breaks, traders often see that as a sign that buyers have taken control and that a bullish breakout trading setup may be forming.

Identifying Promising Breakout Trades
Not every breakout trading setup is worth trading. Good candidates usually show several characteristics.
1. Strong support or resistance
The more times a level has been respected, the more meaningful a breakout becomes.
2. Clear consolidation
Markets often move sideways before breaking. This tight compression shows energy building up.
3. Recognizable price patterns
These include channels, triangles, flags, pennants, and head and shoulders patterns. Patterns do not guarantee results but help highlight where volatility might expand and where breakout trading could make sense.
4. Volume increase
A sharp rise in volume during the breakout adds credibility and reduces the chance of a fake move.
5. Catalyst awareness
Major news can trigger breakouts. Economic announcements often matter more for forex and gold.
AvaTrade, for example, offers easy access to MT4, MT5, and TradingView, allowing traders to mark levels and track volume across multiple asset classes while they prepare their watchlists.
Strategizing Entry Points for Breakout Trades
There are two main entry styles for this approach.
1. Immediate breakout entry
The trader enters as soon as price breaks support or resistance. This captures momentum early but increases the risk of a fakeout.
2. Confirmation entry
The trader waits for a candle close outside the level, strong volume, or a clear pullback. This reduces false signals but may result in a later entry.
Beginners often feel safer waiting for confirmation rather than entering early.
Typical order types include buy stop orders to buy above resistance and sell stop orders to sell below support. These automate the process so the trader does not need to sit in front of the chart all day.
How to Confirm a Breakout
Confirmation is crucial because markets produce many fakeouts, which can damage confidence.
Here are the strongest confirmation methods.
1. Volume expansion
A breakout with low volume is usually a trap. Increased volume means traders are genuinely participating in the move.
2. Candle close beyond the level
Wicks breaking levels mean little. Closing price beyond the level is stronger evidence that the breakout idea is valid.
3. Retest of the broken level
Old resistance becomes new support. Old support becomes new resistance. If price respects the area on the retest, the breakout is more likely valid.
4. Multiple timeframe confirmation
A move seen on both the 15 minute and 1 hour chart is more trustworthy than a move seen on only one.
5. Indicator confirmation
Using tools like RSI or Ichimoku Cloud helps validate the direction and strength of the move and adds structure to your breakout trading system.
What Is the Best Indicator for a Breakout Trading System?
While this style can be traded using pure price action, several indicators help strengthen the analysis.
Ichimoku Cloud
When price breaks above or below the cloud, it can confirm trend direction. This is popular among traders who like visual clarity and want to filter breakout trading signals.
RSI
RSI helps confirm whether momentum supports the breakout. RSI moving with price suggests continuation, while divergence often warns of a weakening move.
Moving Averages
Breakouts above major moving averages can strengthen a bullish case. Moving averages also help determine trend direction and can act as dynamic support or resistance.
ATR
The Average True Range helps gauge volatility. ATR based stops make risk management easier and more consistent.
Volume Indicators
This style relies heavily on volume. Any spike in volume strengthens the breakout and signals that more participants are engaging with the move.
Using several of these tools together creates a more reliable breakout system trading approach.
Crafting Exit Strategies for Breakout Success
1. Where to Exit With a Profit
Targets can be created using the height of the pattern for channels and triangles, recent swing measurements, or ATR multiples. Scaling out, or taking profit in stages, helps secure gains while leaving room for continuation in your breakout trading positions.
2. Where to Exit With a Loss
If price breaks back inside the level after a retest, the breakout has likely failed. Beginners should cut losses quickly rather than hoping for a reversal. This keeps the focus on strong trends and not on rescue trades.
3. Where to Set a Stop Order
Stops should sit just beyond the broken level, not too tight and not too wide. The goal is to allow retests while preventing unnecessary losses.
Pros and Cons of Breakout Trading
This section looks at how breakout trading performs in real conditions.
Pros
- Clear entry and exit levels
- Works across many markets
- Can capture strong momentum
- Easy to automate
- Beginner friendly once the rules are understood
Cons
- Fakeouts are common
- Markets can reverse suddenly
- Requires patience
- Needs discipline
- Costs can increase with frequent trades
Quick Guide to Breakout Trading Steps
- Identify strong support or resistance
- Wait for price to approach the level
- Confirm volume and candle close
- Enter the trade according to your rules
- Set stops appropriately
- Let the trade retest if needed
- Hold until target or invalidation
- Exit responsibly and review the setup afterward
Real Case Study: Gold Breakout Above 2070
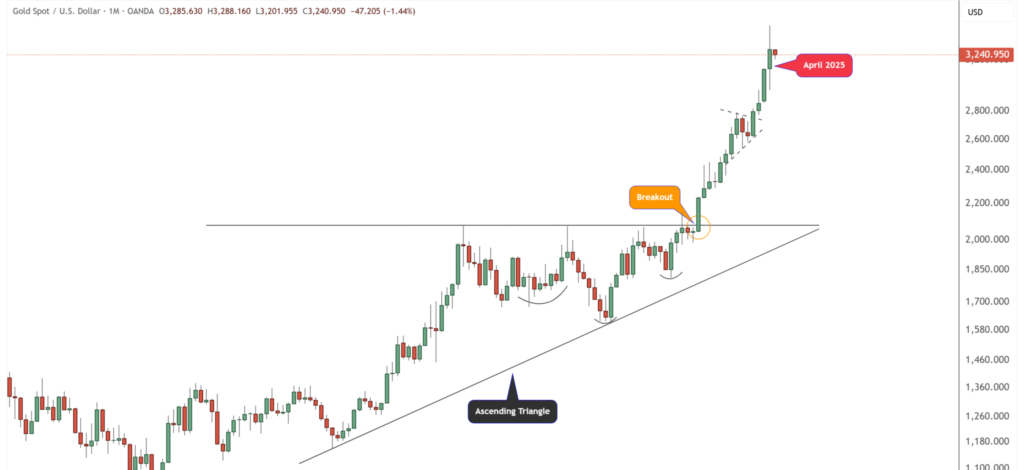
A recent notable example of a gold price breakout occurred in 2024 and extended into 2025, when gold surged past the $2,070 resistance level, marking the breakout from a nearly decade-long ascending triangle pattern formed since 2015. This breakout was supported by strong volume and momentum, driving gold prices up to around $3,500 in April 2025 before pulling back slightly to $3,200. The breakout confirmed the validity of this classic continuation pattern and was further reinforced by an inverted head-and-shoulders pattern, signaling a sustained bullish trend. This event set the stage for gold potentially reaching even higher price targets such as $4,000 and beyond, indicating a new bullish era underpinned by long-term accumulation and technical strength.
This example stands out as a clear technical breakout from a multi-year consolidation, supported by significant bullish patterns and momentum.

(Source)
Does Breakout Trading Work?
Yes, breakout trading can work, but only with discipline and consistency. It performs best in trending markets and during periods of high volatility. It performs poorly in quiet, choppy conditions.
Success depends on consistent rules, avoiding emotional decisions, proper confirmation, and sound risk management.
What Is the Best Time Frame for Breakout Trading?
Breakouts work on all time frames, but each behaves differently.
- Lower time frames: More signals but more noise
- Higher time frames: Fewer signals but stronger moves
- Daily and weekly: Often best for swing traders
- 1 hour to 4 hour: A great balance for many beginners
Is Breakout Trading Good for Beginners?
Yes, breakout trading is beginner friendly because levels are easy to mark, rules are simple, and entries and exits are clear.
The biggest challenge for beginners is patience. They often jump in early or chase moves that have already happened. A structured breakout trading system helps prevent these mistakes.
Frequently Asked Questions
What is a breakout in trading?
It is when price moves beyond a key support or resistance level with increased momentum. Many strategies rely on this basic idea.
Is breakout trading profitable?
It can be profitable when rules are followed and trades are confirmed properly, but there are no guarantees.
How to confirm a breakout?
Use volume, candle close, retests, indicator support, and multi timeframe alignment.
Is breakout trading good for beginners?
Yes. It is simple to understand and works across all asset classes, especially when practiced with proper risk control.
The Bottom Line
This method, built around breakout trading, gives traders a structured, reliable, and simple way to participate in market momentum. With strong levels, clear confirmations, sensible stops, and the help of platforms like MT4, MT5, and TradingView, traders can learn to execute these setups with confidence.
AvaTrade provides access to these platforms along with the tools needed to mark levels, track price action, and monitor volume. With practice, patience, and a focus on confirmation, breakout trading becomes a powerful strategy for traders looking to understand how markets truly move.
Disclaimer: Remember that CFD trading involves high risk. Always do your own research and never invest what you cannot afford to lose.
 19th Nov 2025


